
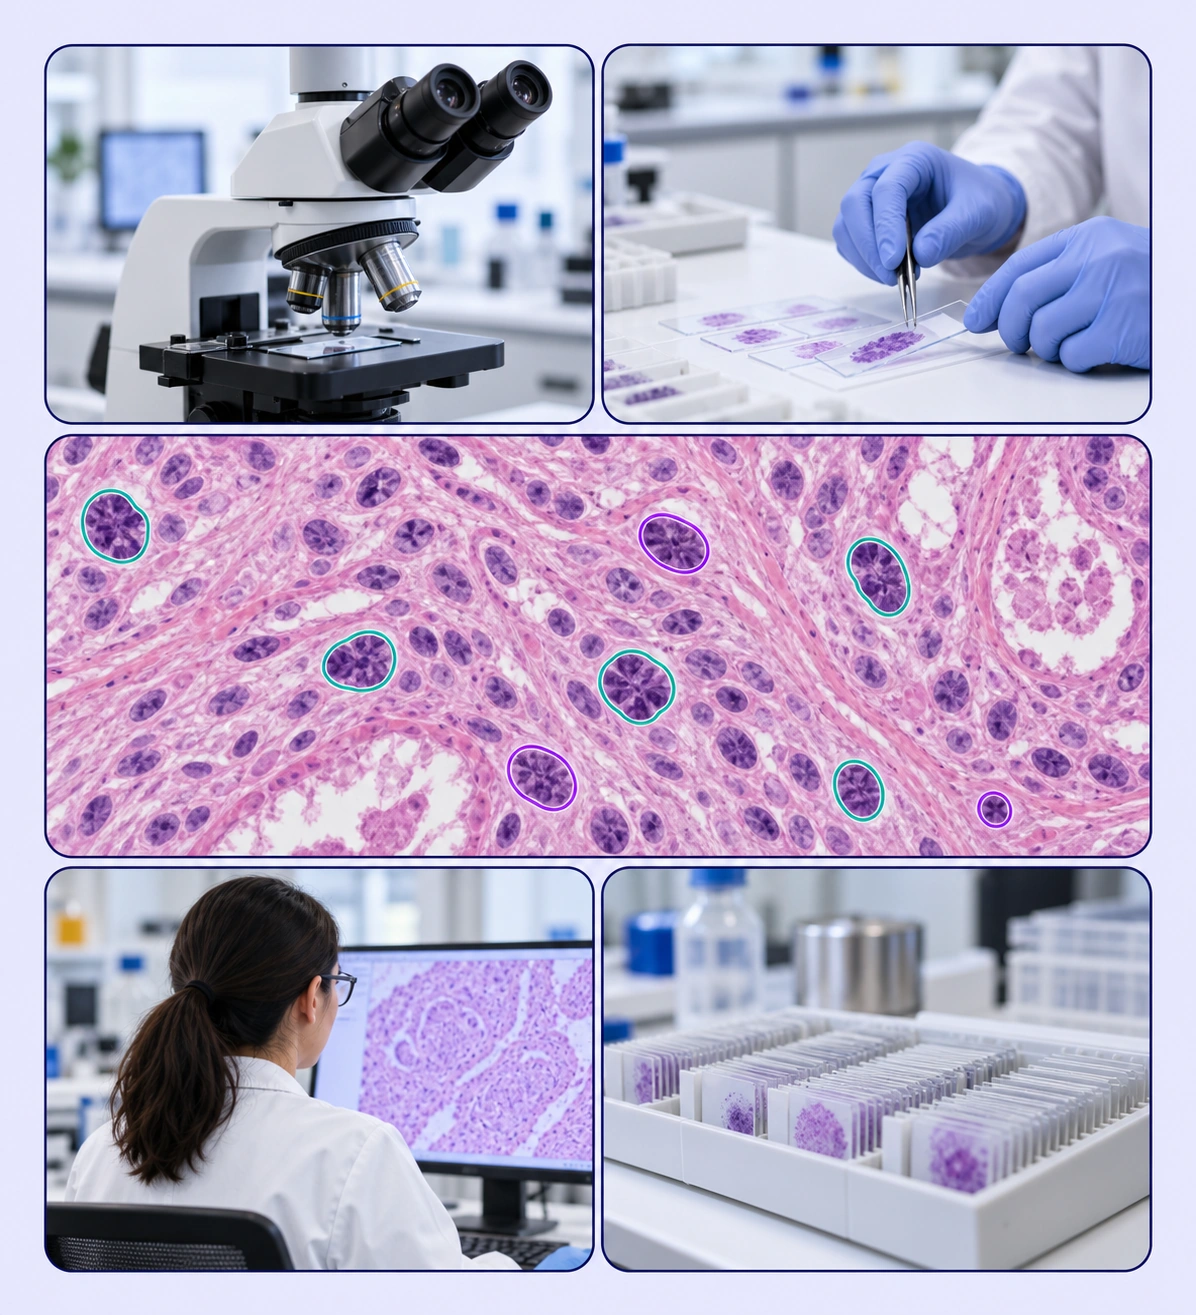
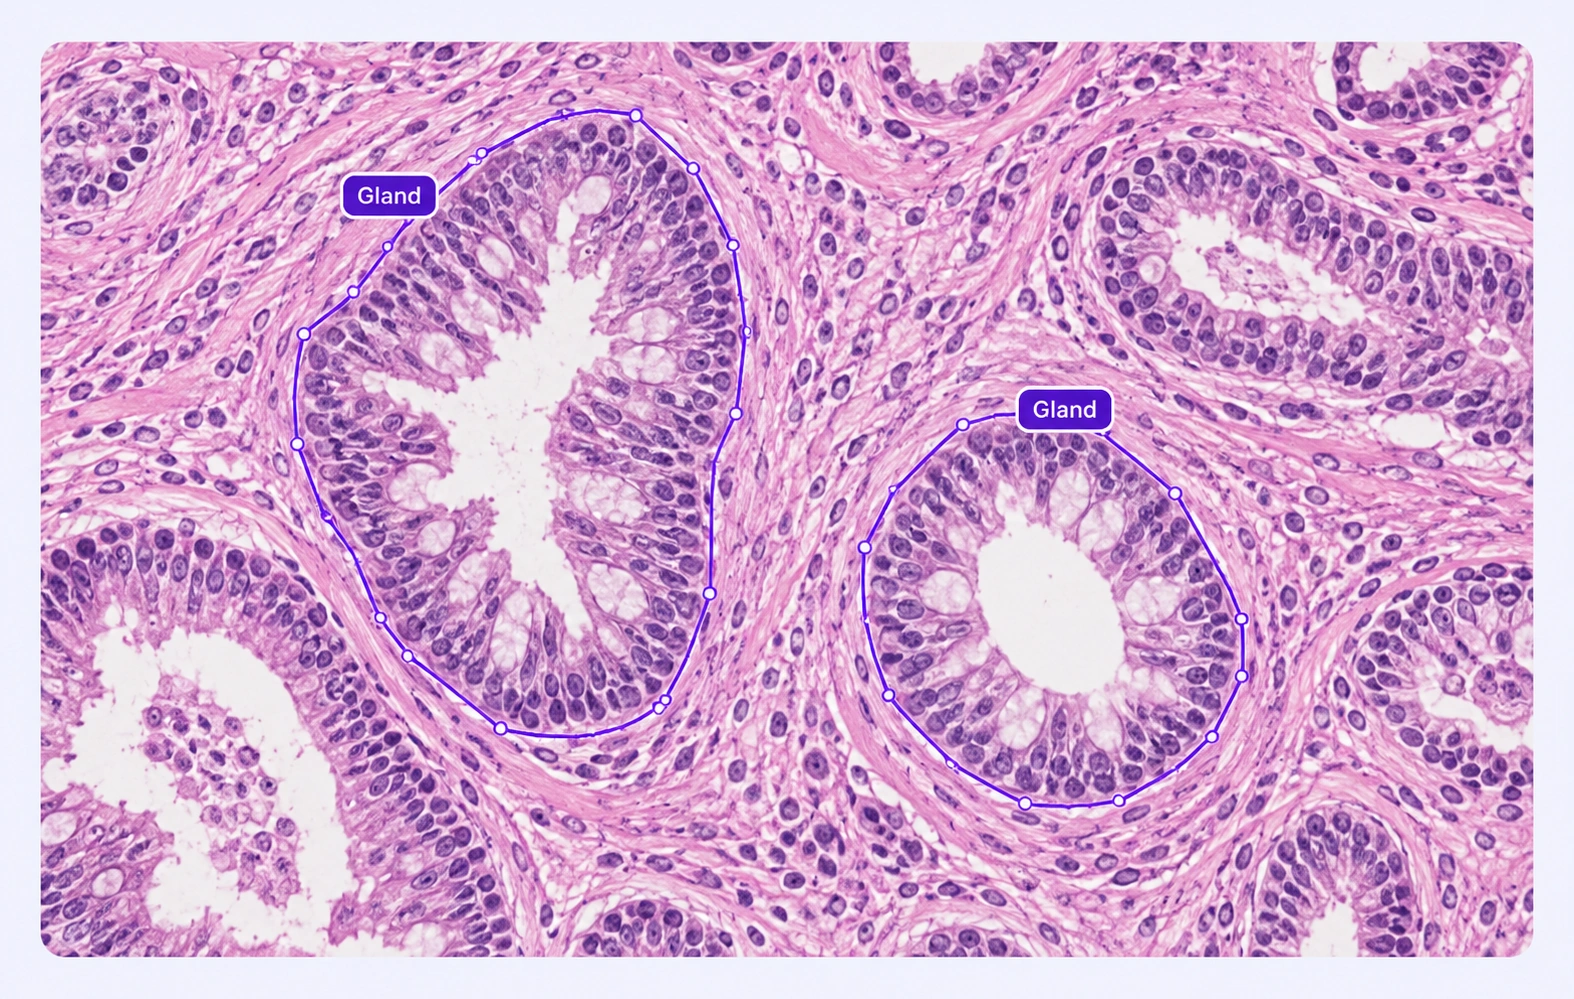
Label cells and nuclei with model-assisted tools and expert review workflows.
Automate curation, management, and versioning of cell and nuclei datasets.
Reusable ontologies and governed quality control reduce labeling and review rework.
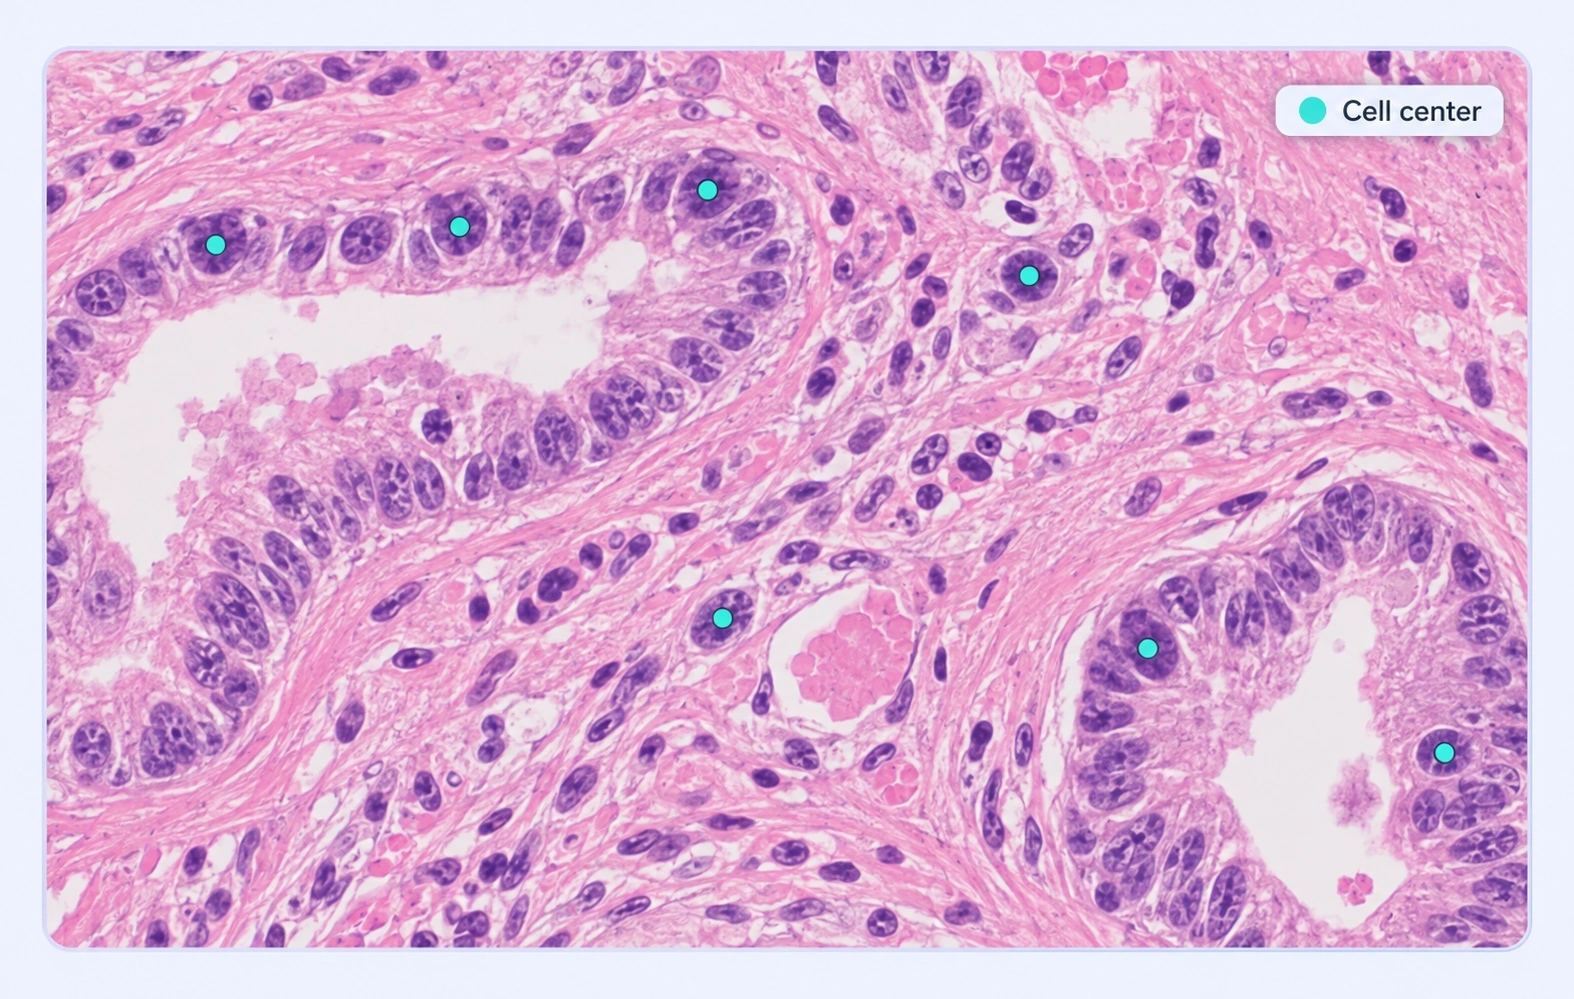
Use point locations or labeled regions to represent individual cells according to your model’s target format.
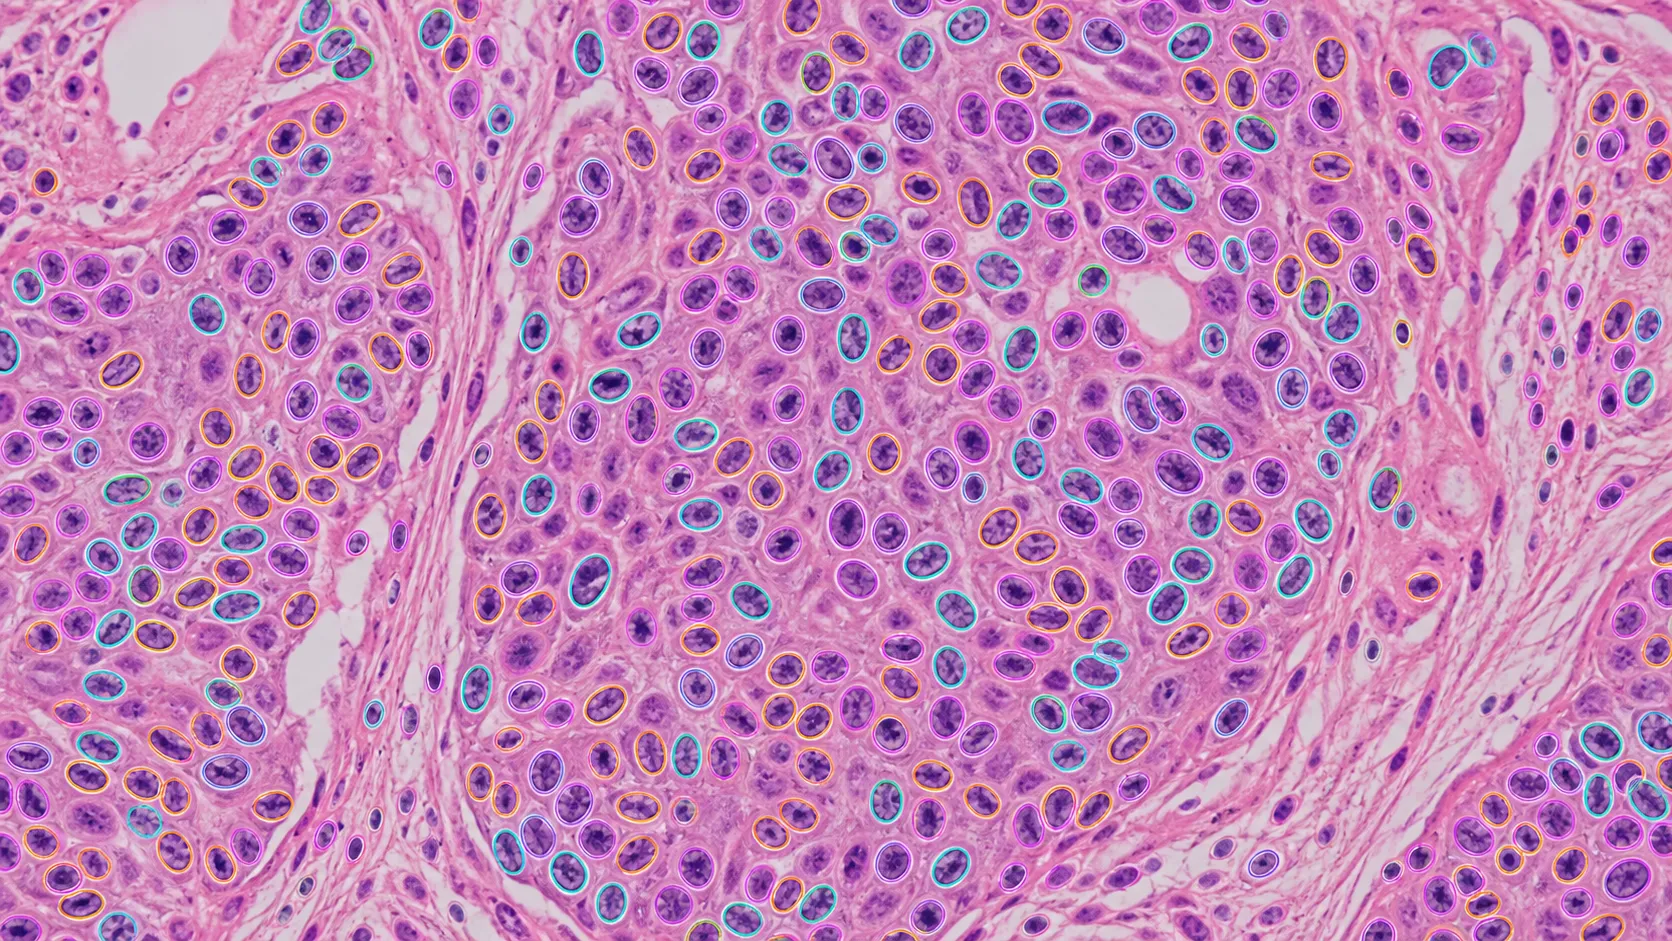
Trace nuclear boundaries with polygons or masks for tasks that require cellular shape information.
It labels individual cellular structures in pathology images so models can learn where they are, which class they belong to, or how their boundaries are shaped.
Yes. Use points or regions for location tasks and contours or masks when your model requires more detailed shape labels.
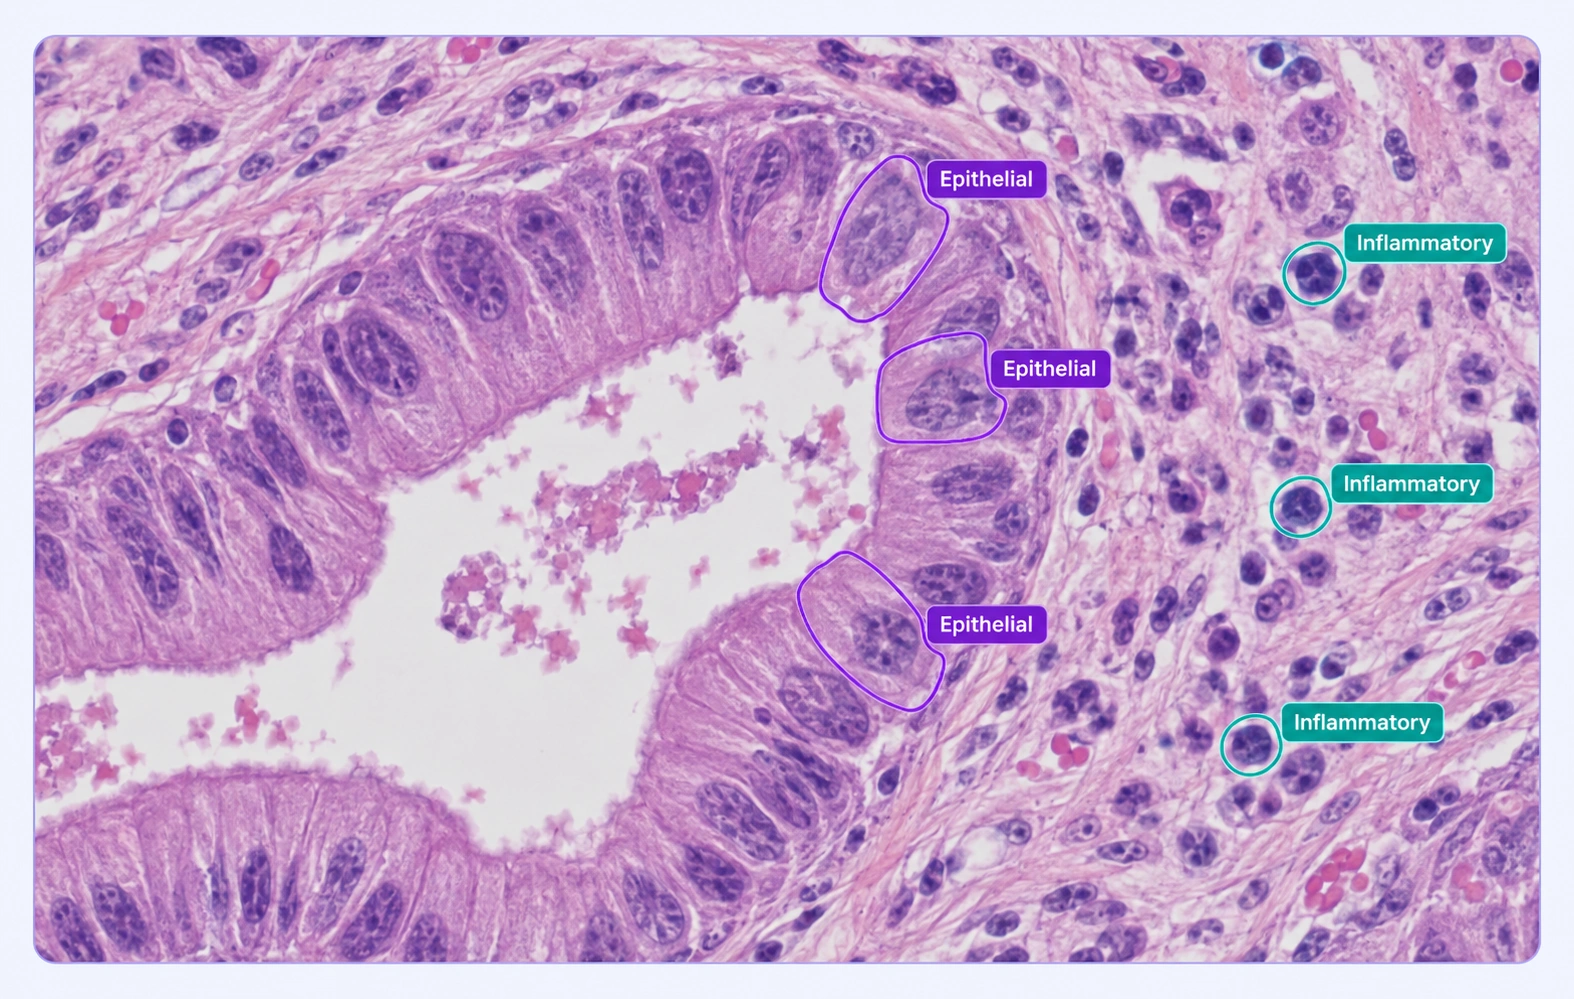
Yes. Your ontology can define the cellular categories and properties required by the annotation protocol.
Yes. The tiled slide viewer supports navigation across large images and close inspection of cellular details.
The workflow creates reviewed cellular labels that can support downstream analysis. Counting rules and clinical scoring should be defined and validated by your team.
Document how boundaries and uncertain examples should be handled, then use specialist review to resolve the cases before release.
Supported inputs include SVS, AVS, NDPI, SCN, BIF, SVSLIDE, tiled TIFF, and single-file OME-BigTIFF slides. Tiled navigation lets teams inspect large slides at different zoom levels.
Reviewers inspect cellular or tissue boundaries in slide context, discuss uncertain regions, and return corrections through the configured workflow. Shared classes keep the annotation protocol consistent.
Yes. Pathology labels retain the original full-resolution raster coordinate space. Supported formats include COCO, YOLO, and Unitlab Unified Export Format, depending on the annotation data you need.


We use cookies to improve your experience. See our Privacy Policy and Cookie Policy.