Range annotation for sensor signals
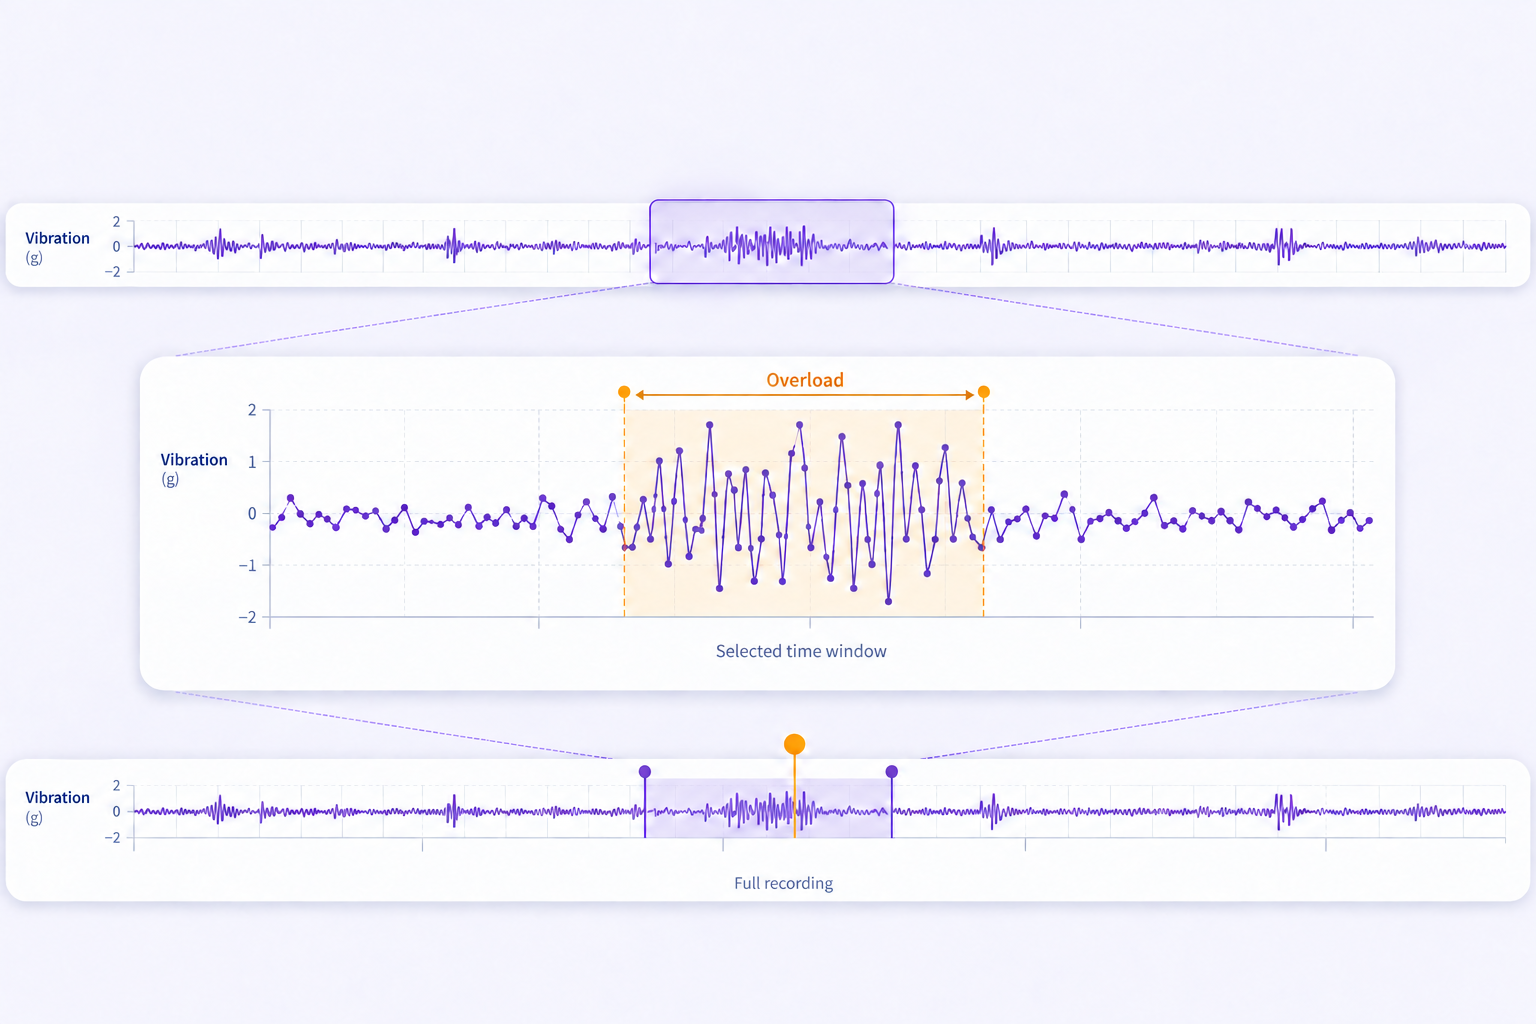
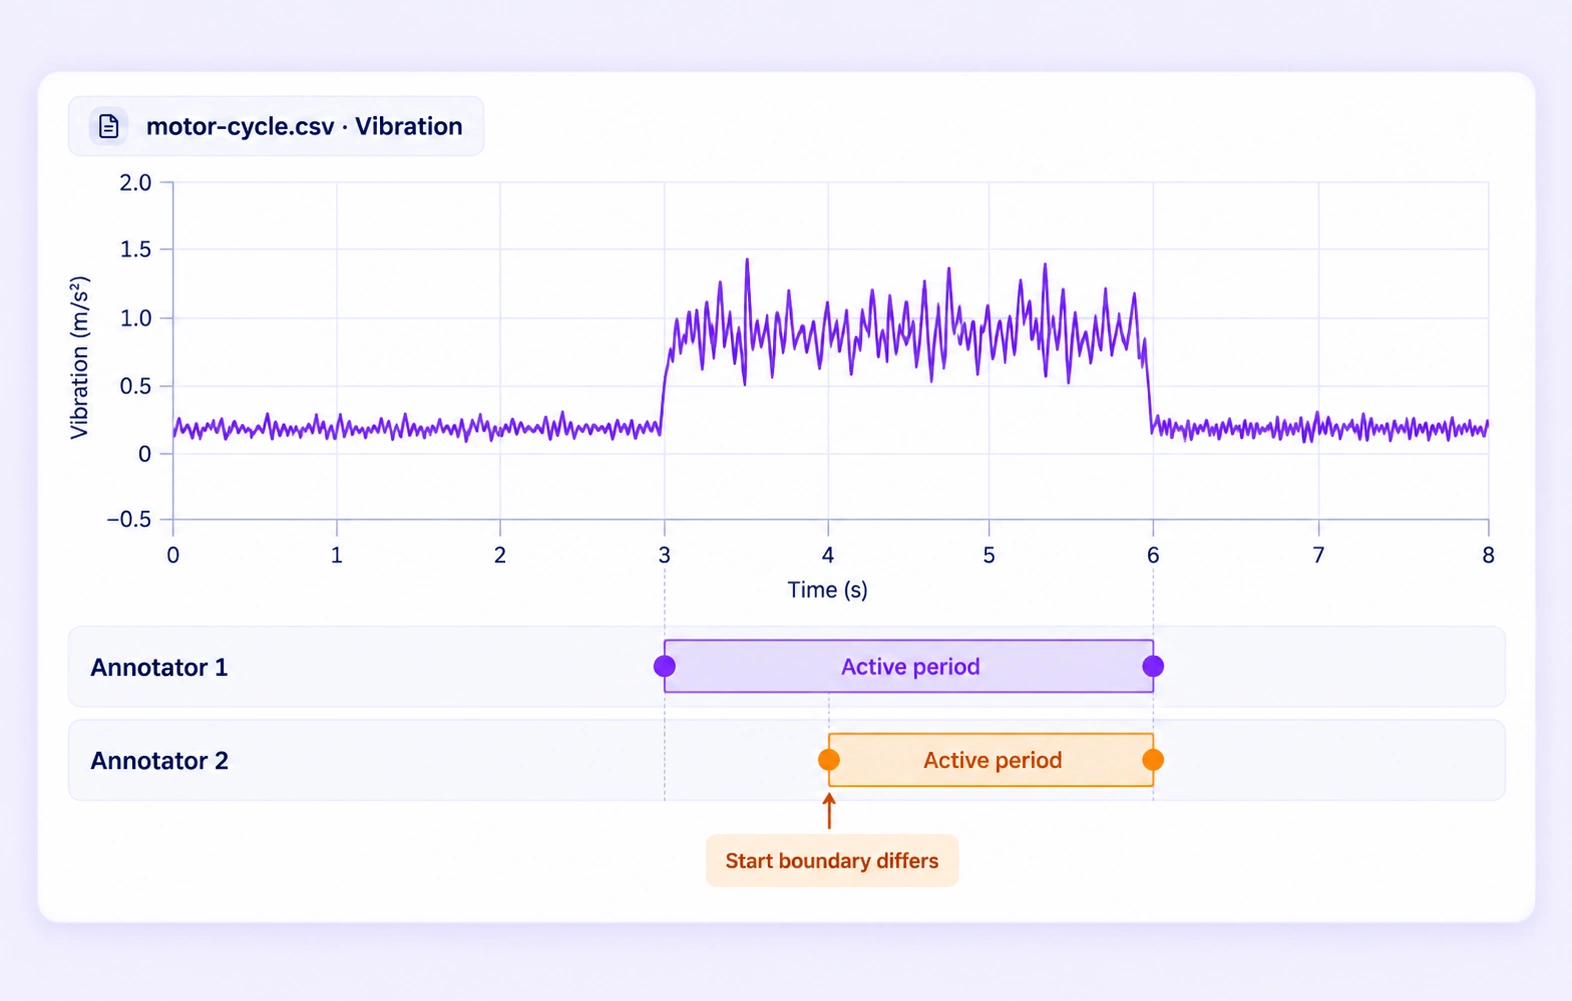
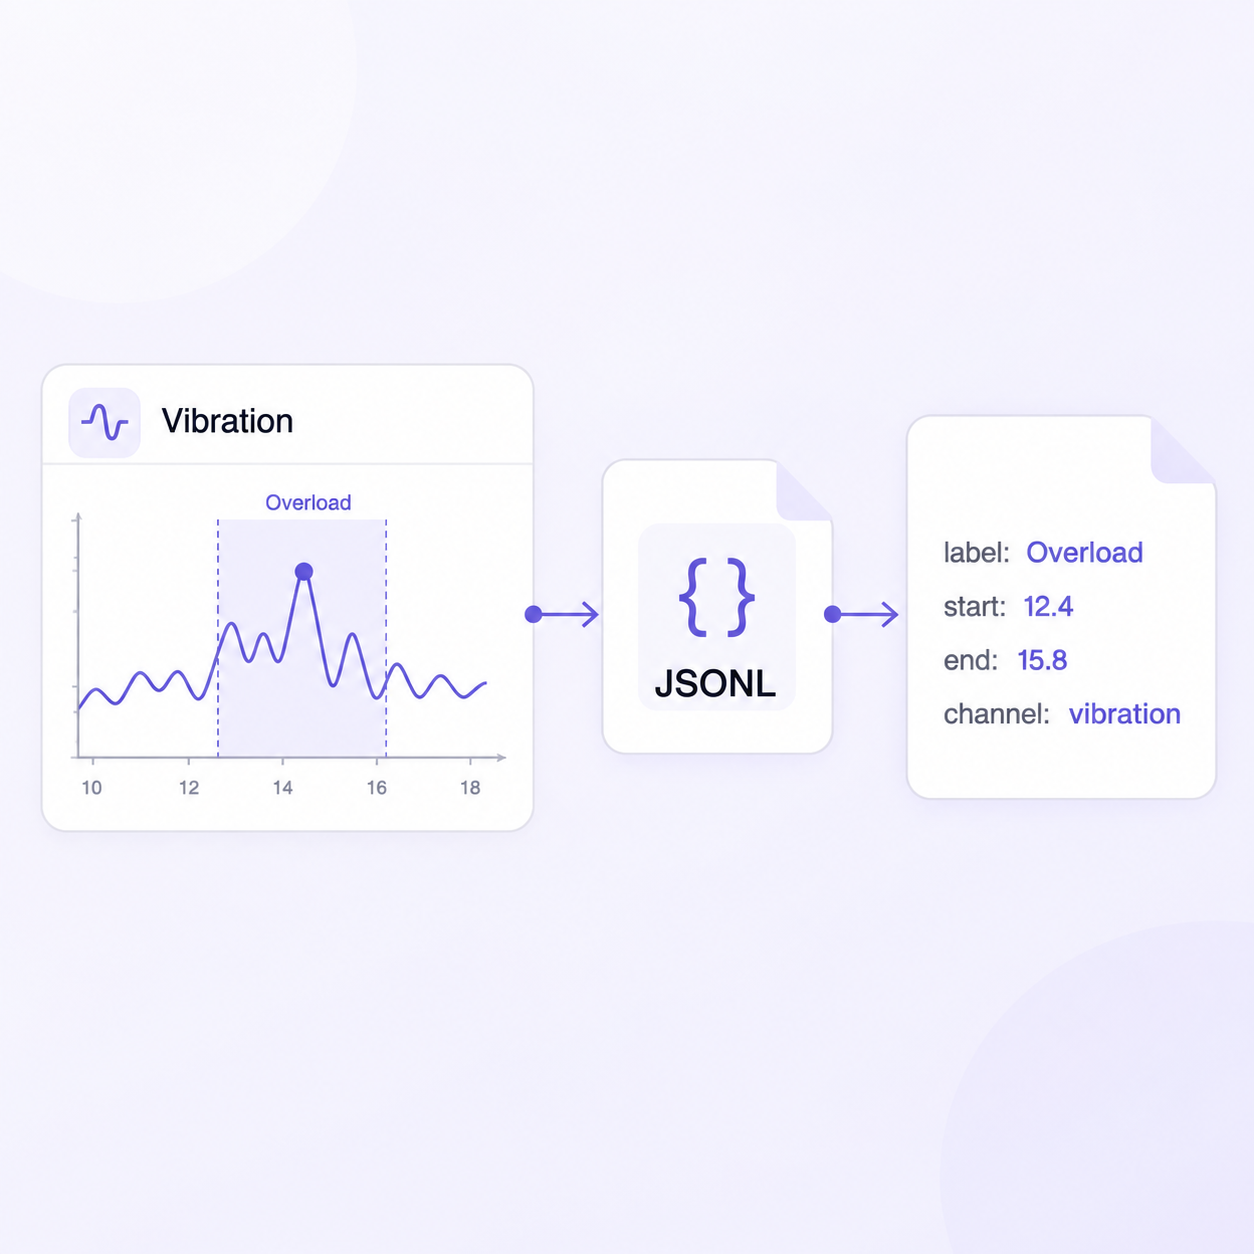
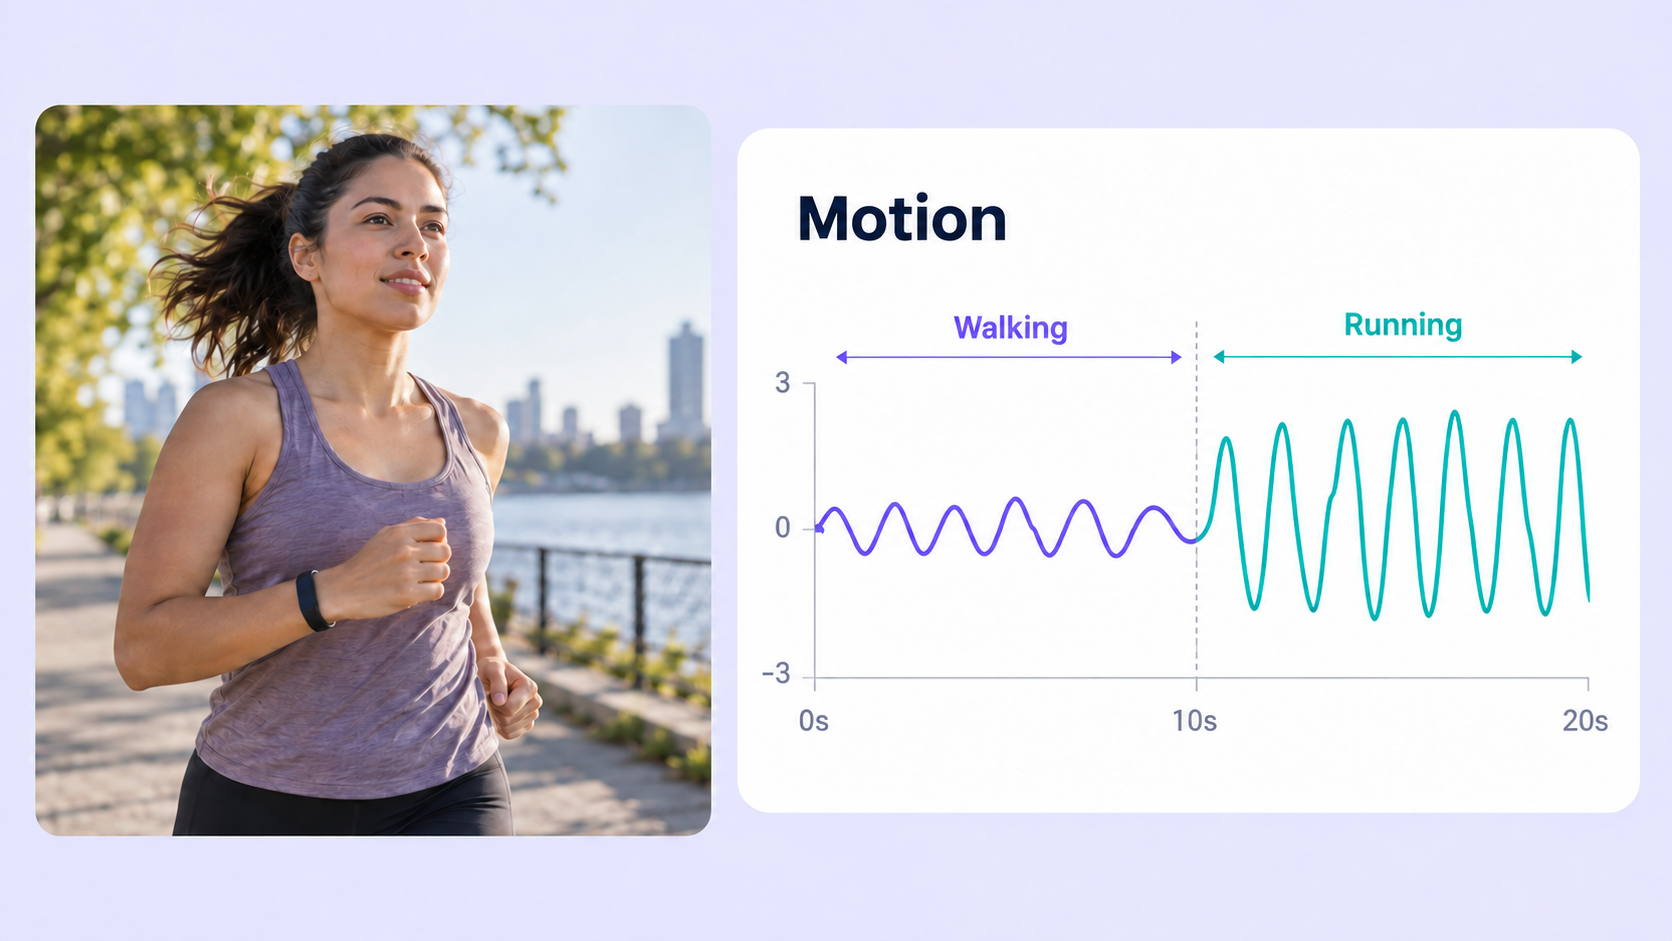
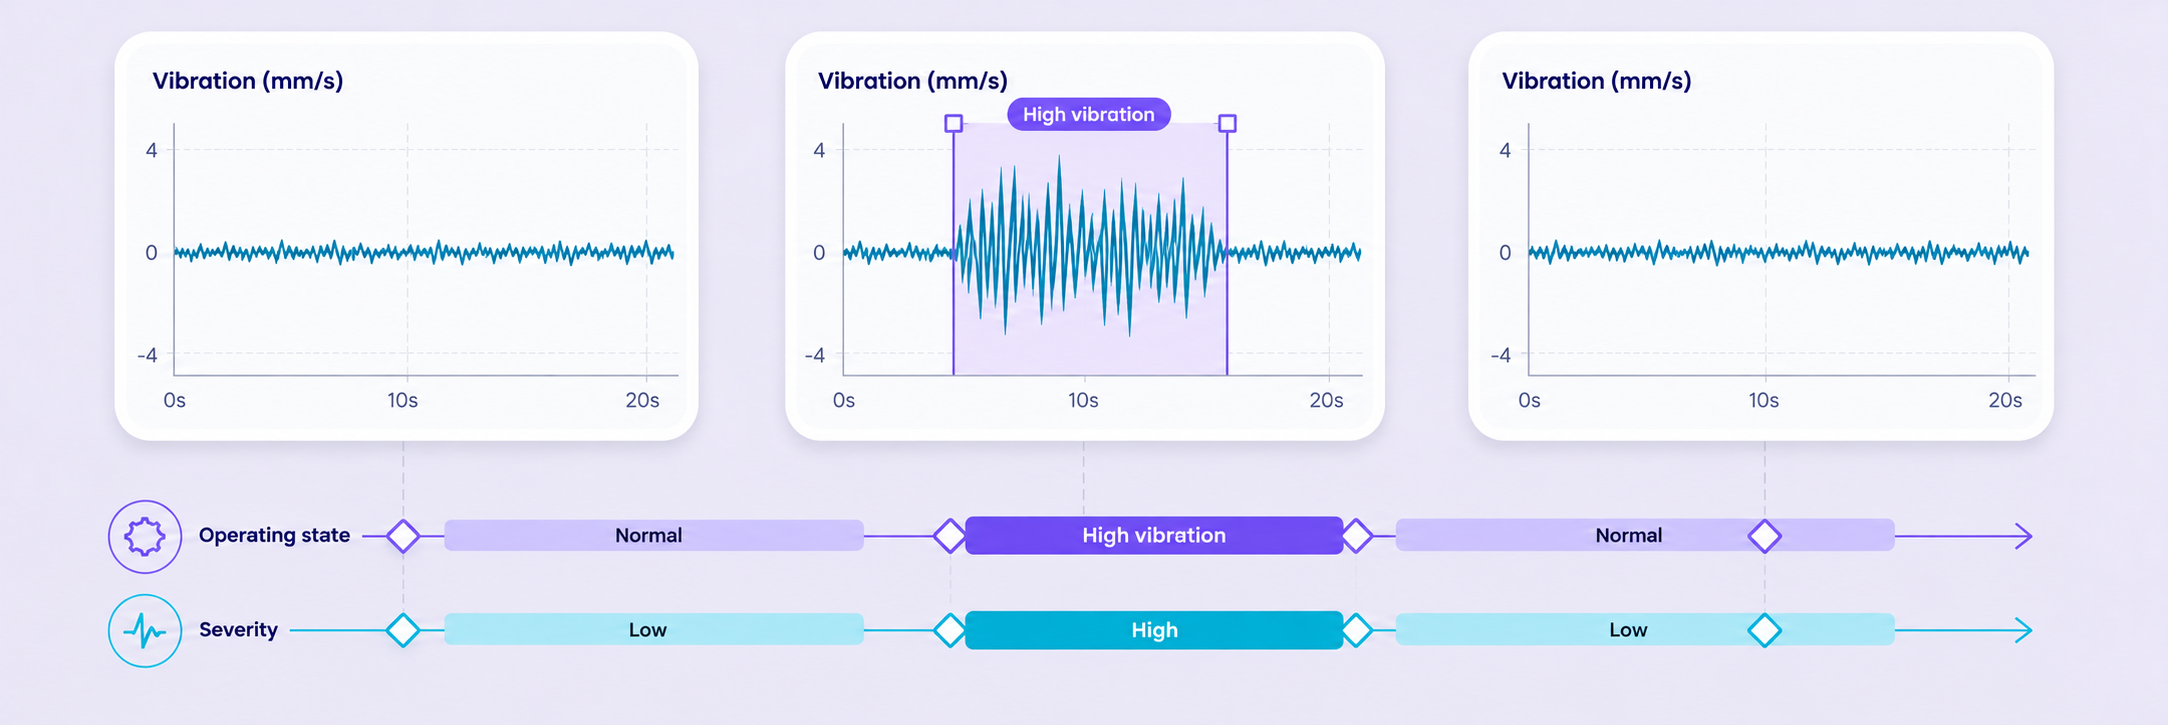
Label meaningful intervals directly on sensor charts. Capture operating states, sustained anomalies, and recurring patterns with ranges scoped to one channel or the full recording.
Curate, label, and review sensor training data with precise range and point annotations, multichannel charts, advanced ontologies, and governed quality workflows.
Label operating states and events, inspect related channels, and review time-series data with its measurement context intact.

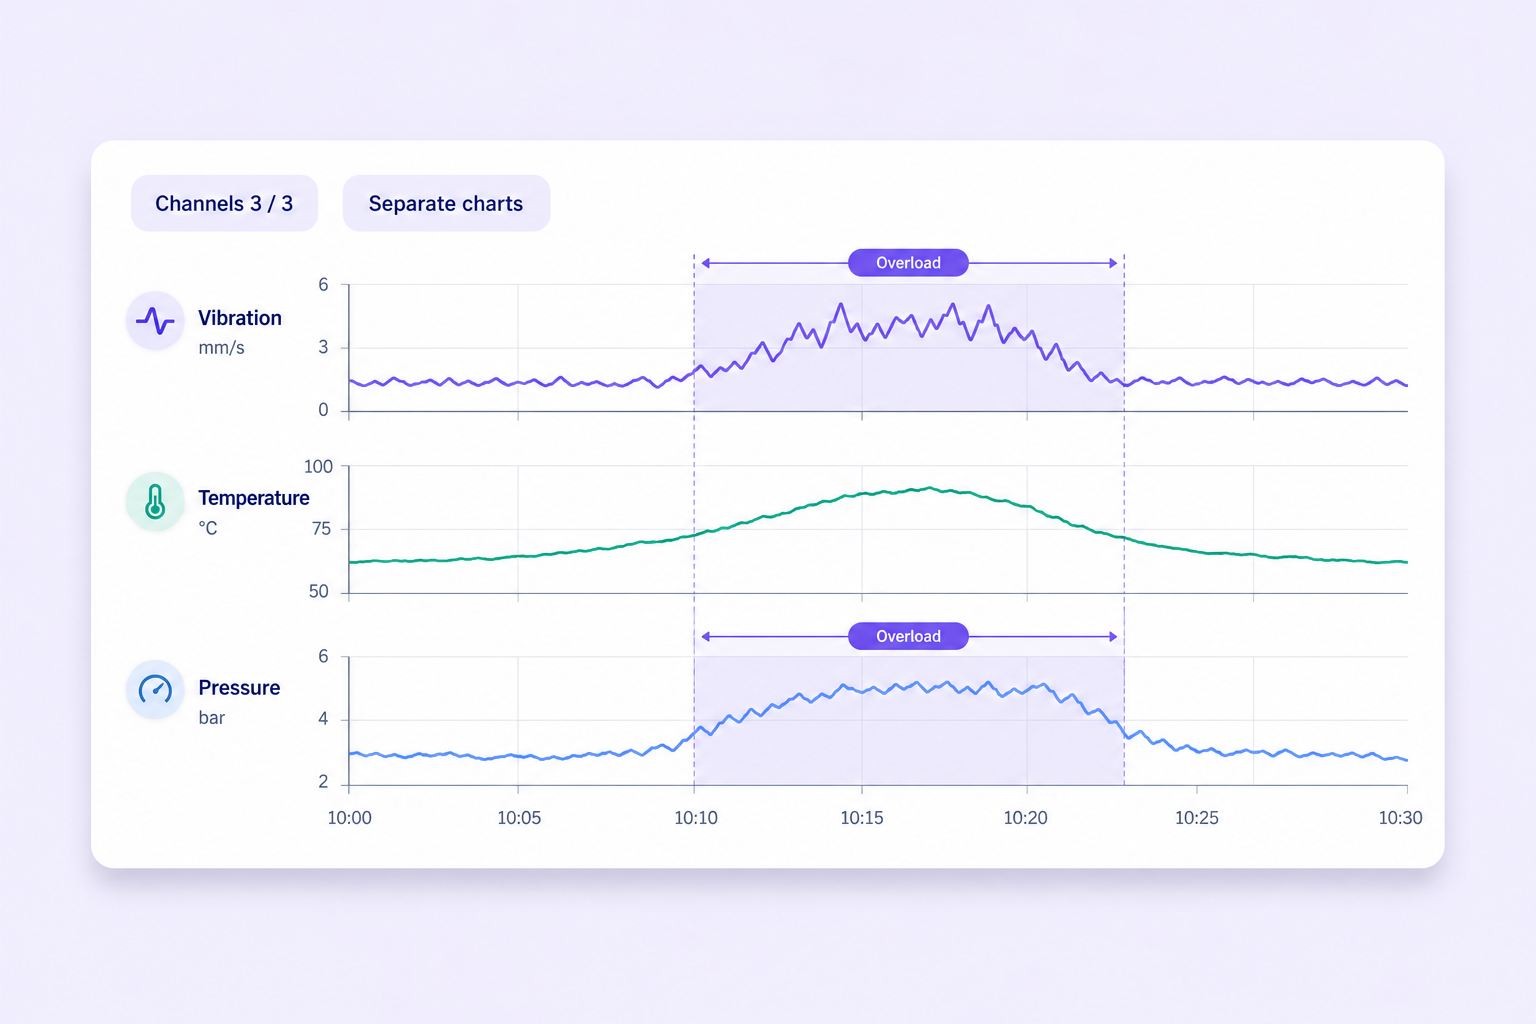
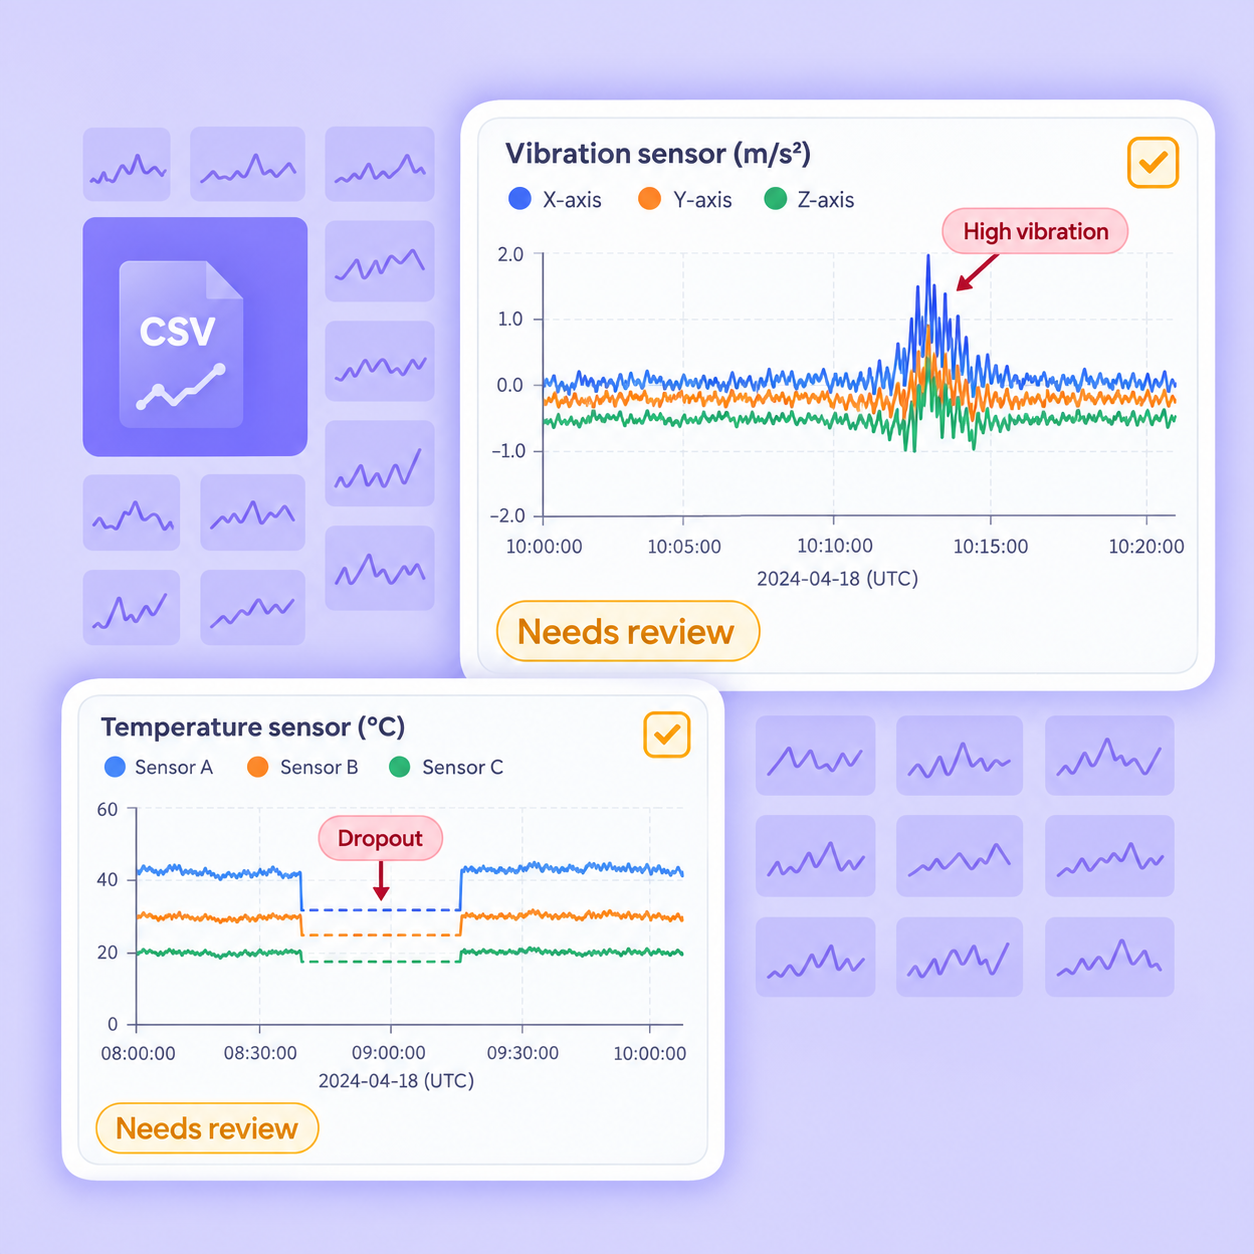
Label meaningful intervals directly on sensor charts. Capture operating states, sustained anomalies, and recurring patterns with ranges scoped to one channel or the full recording.

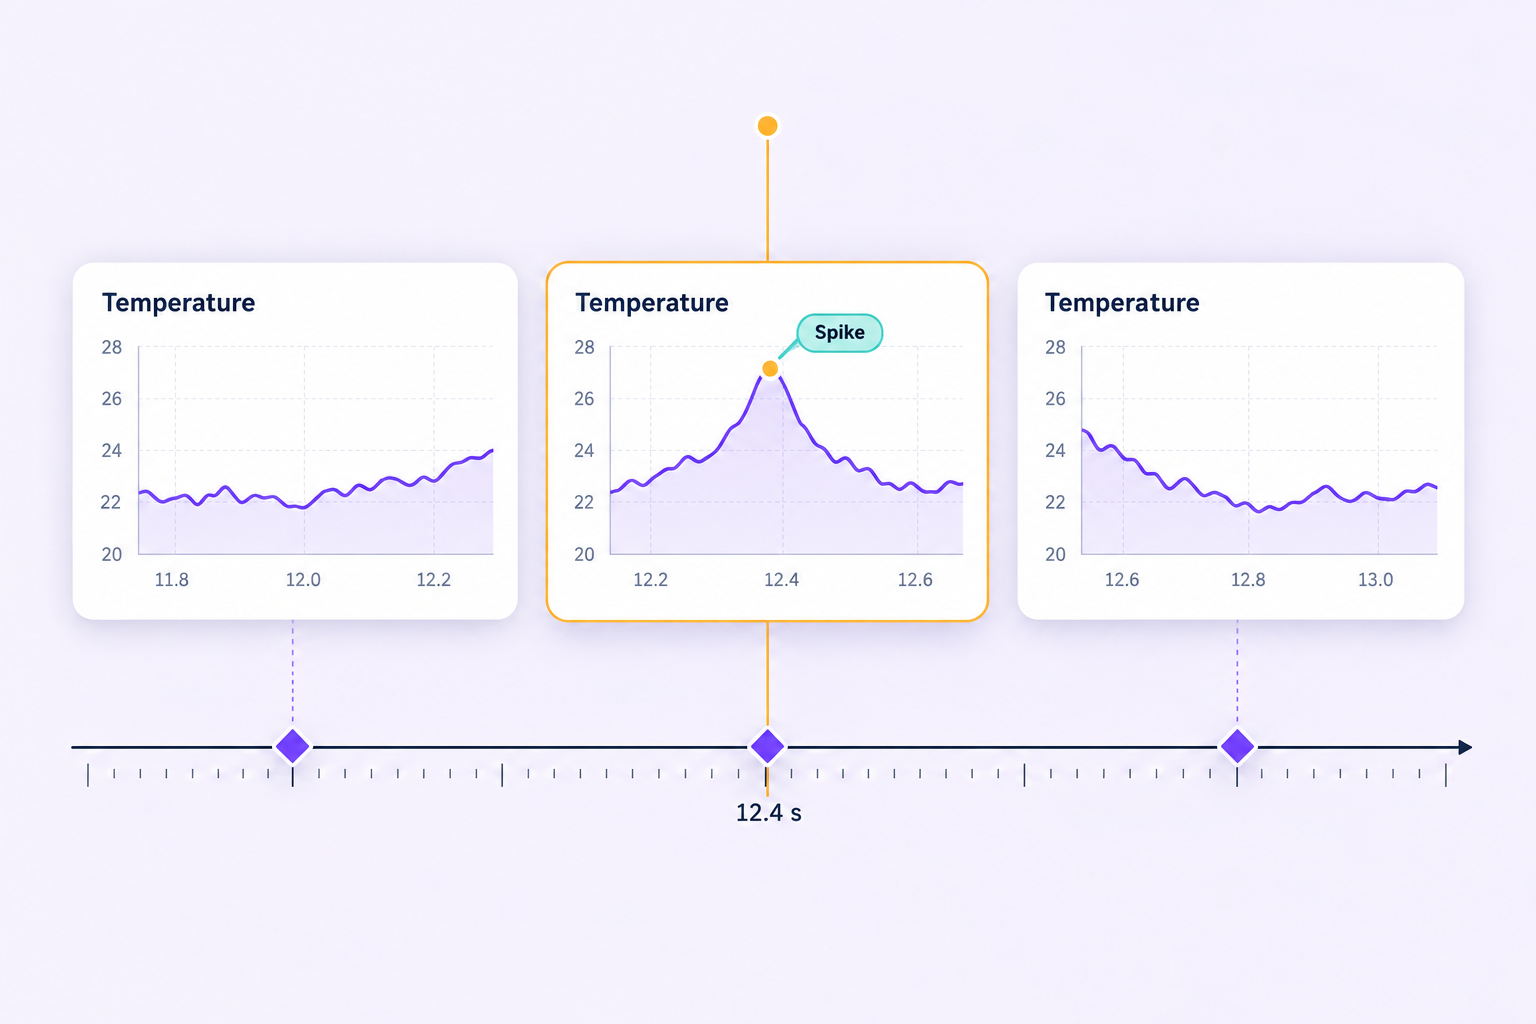
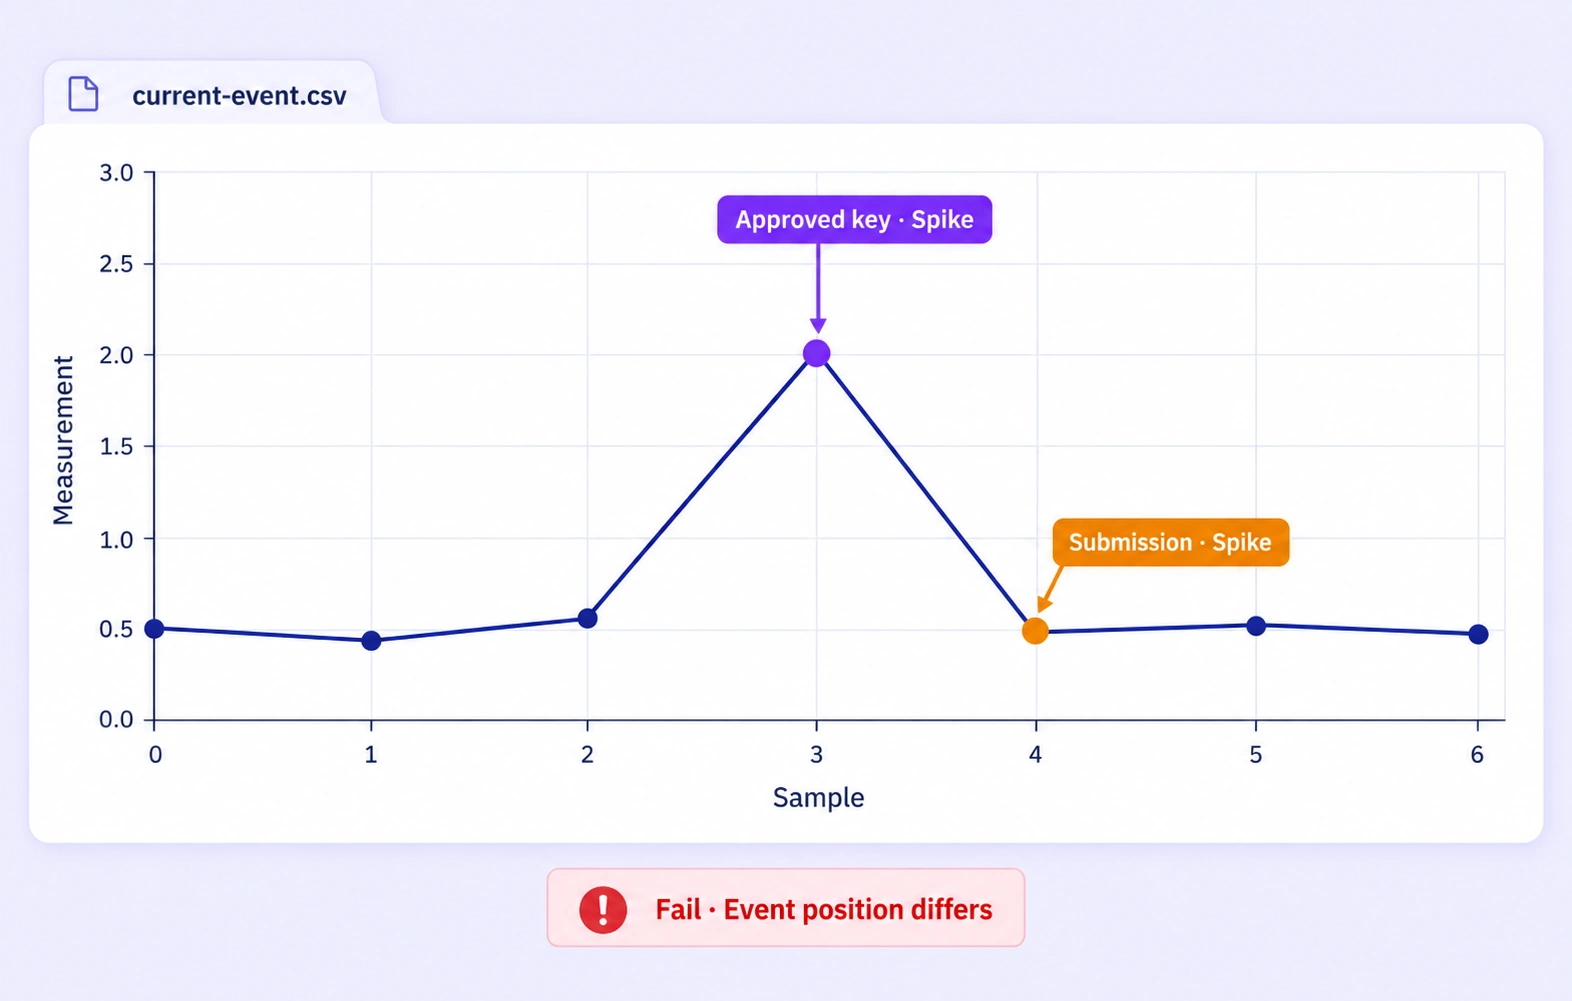
Mark individual samples to capture spikes, transitions, and other precise events. Preserve each point's X-axis value and channel context.

Compare measurements in separate charts or one combined view. Select the channels you need while keeping a shared X-axis window.

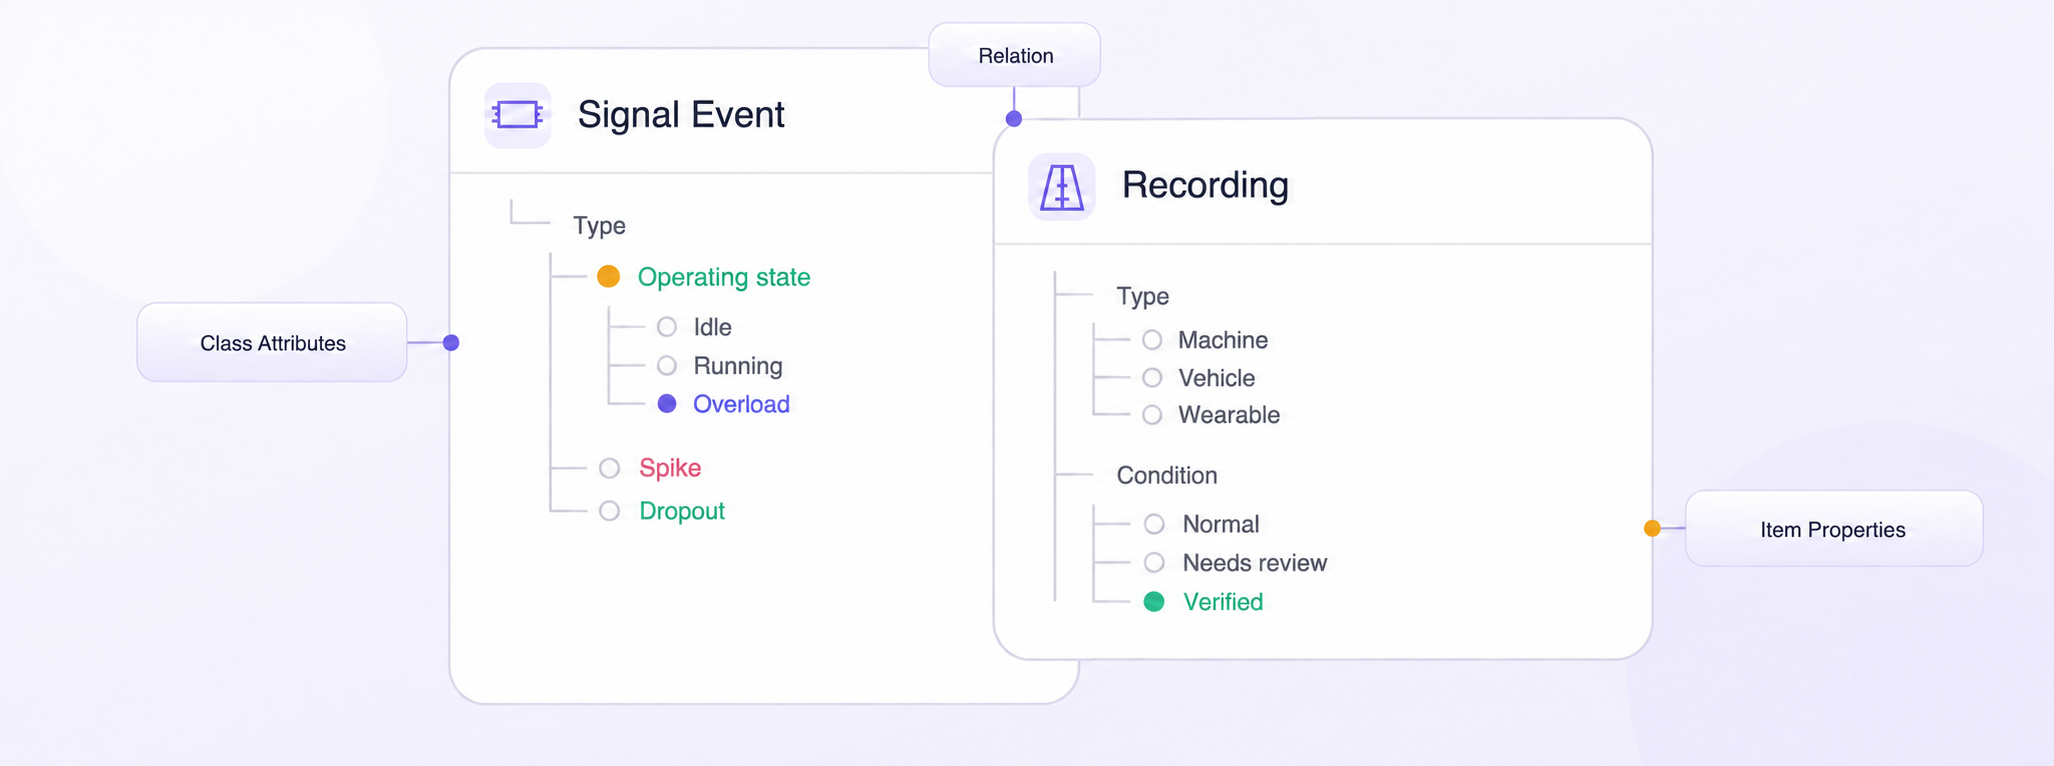
Define range and point classes, nested properties, and relationships. Standardize event type, severity, and recording context with a reusable, versioned ontology.

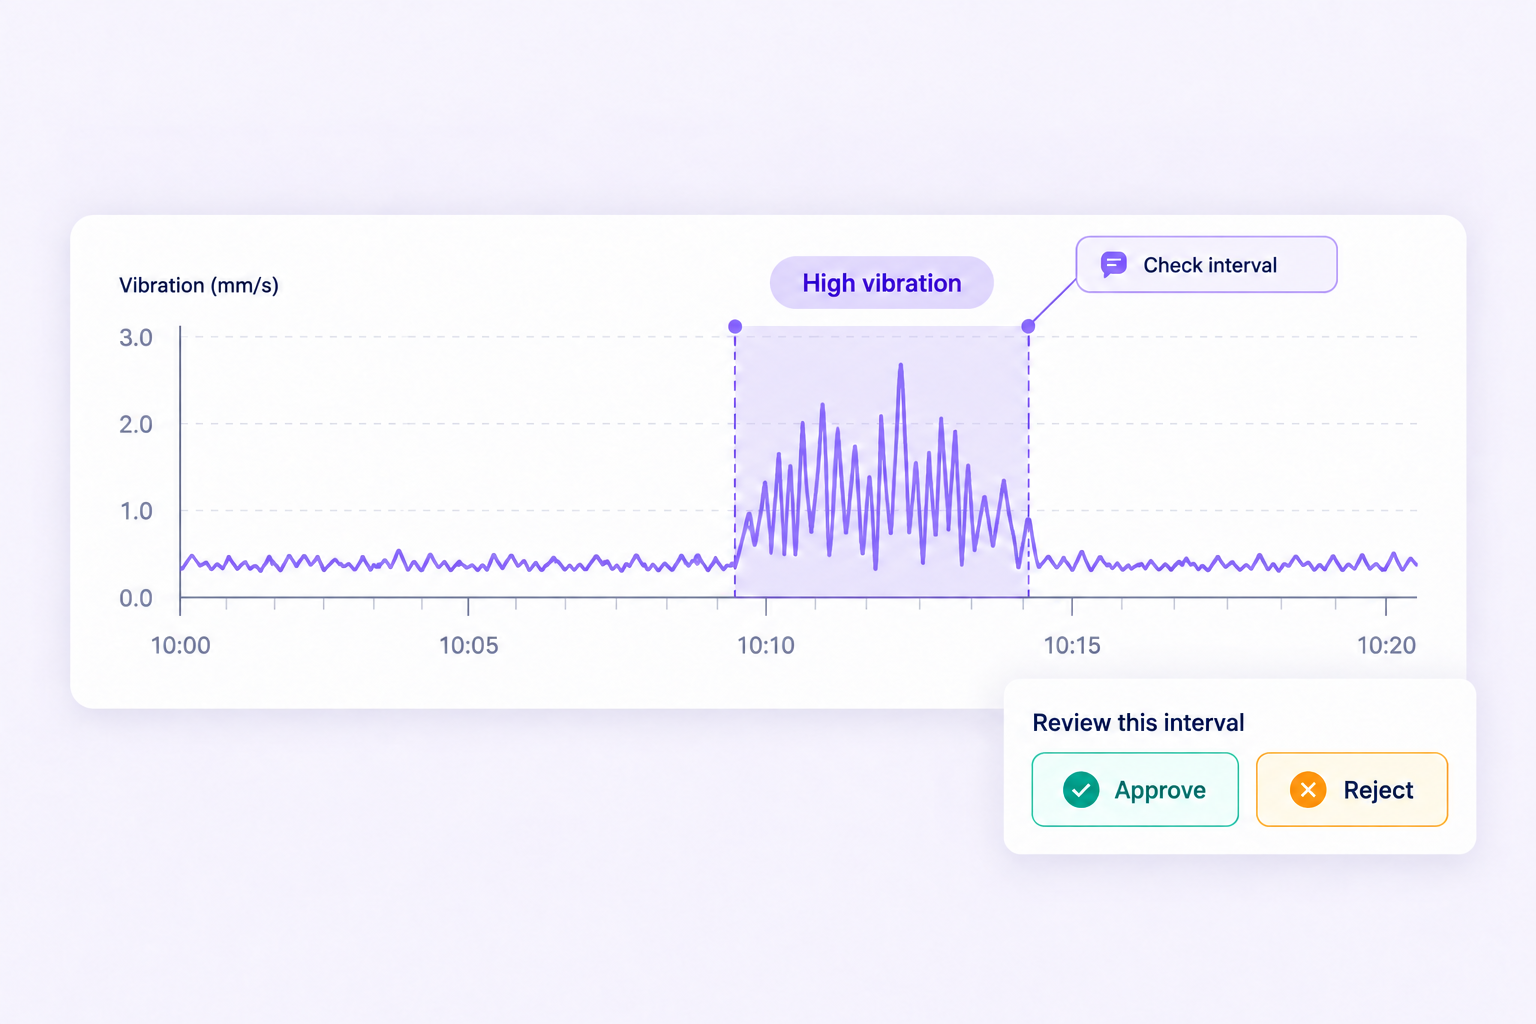
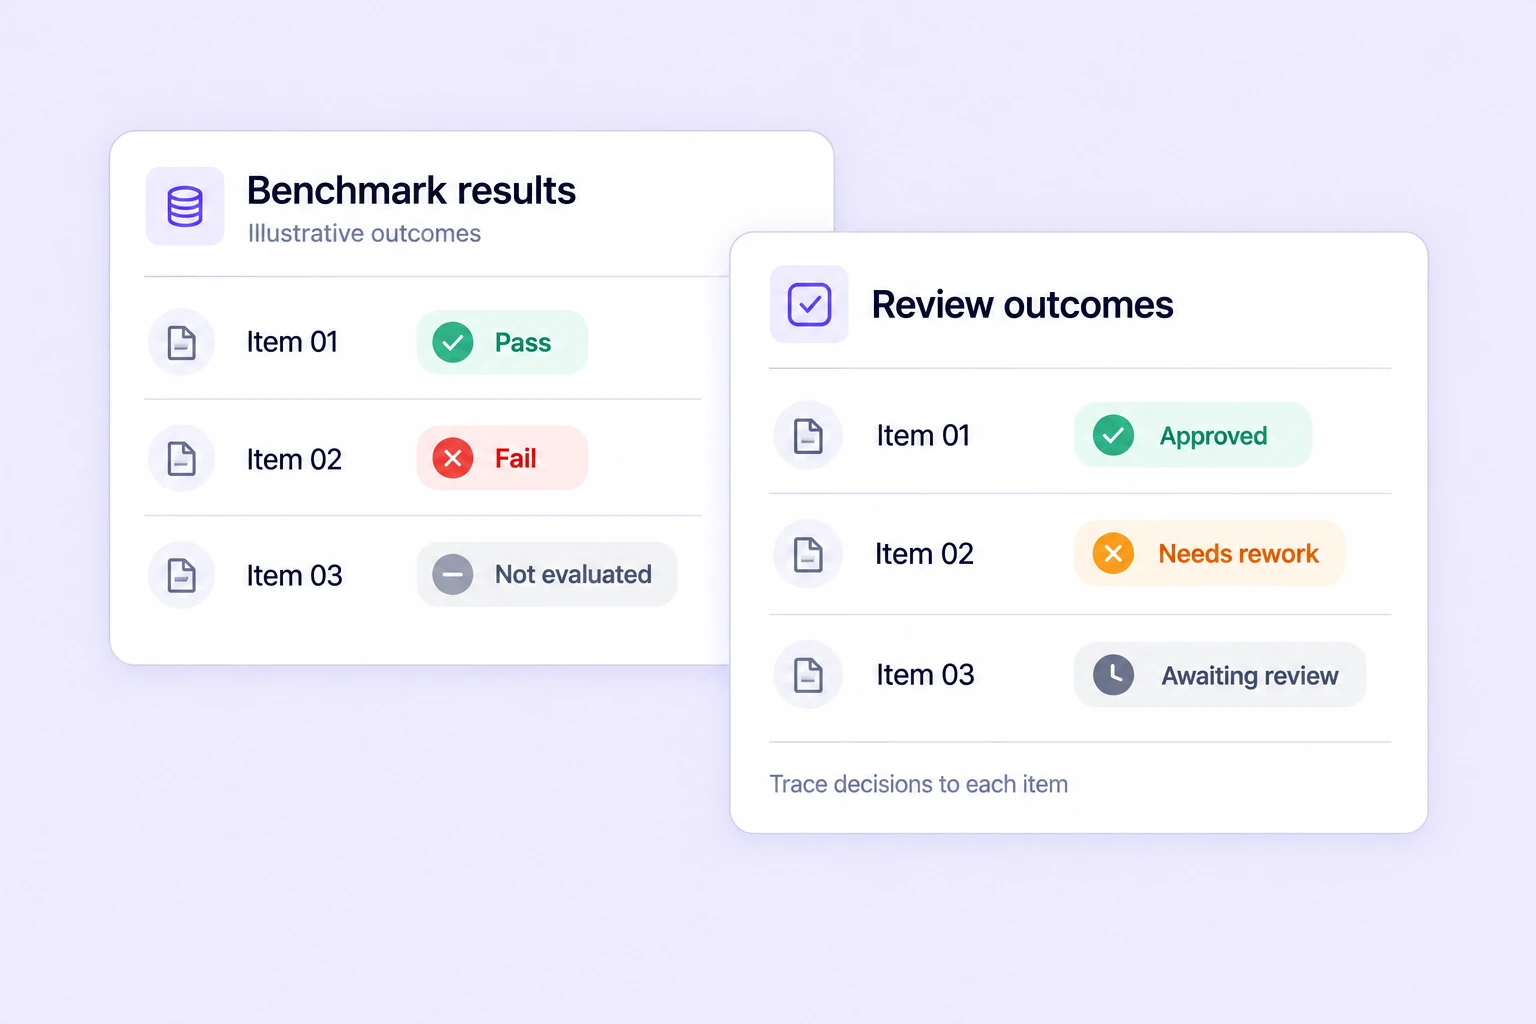
Inspect sensor labels, discuss uncertain intervals, and route corrections through review. Keep each quality decision connected to the measurements it describes.

Zoom into short events and pan through longer recordings. Use the full-series overview to retain context while placing and inspecting exact sensor labels.
Connect sensor data, labeling context, and quality review in one workspace, from raw CSV measurements to reusable training datasets.
Combine time ranges, point events, structured properties, and relationships to describe what happens in your sensor data.
Mark operating states and sustained events with labeled start and end values on the sensor chart.
Pinpoint spikes, transitions, and other events at individual samples, with the original channel context.
Classify recordings and capture source, operating condition, quality, and other structured metadata.
Connect annotations with ontology-defined relationships to preserve the context between labeled events.
Find, select, and version sensor recordings, then move labels through annotation, review, and controlled dataset export.

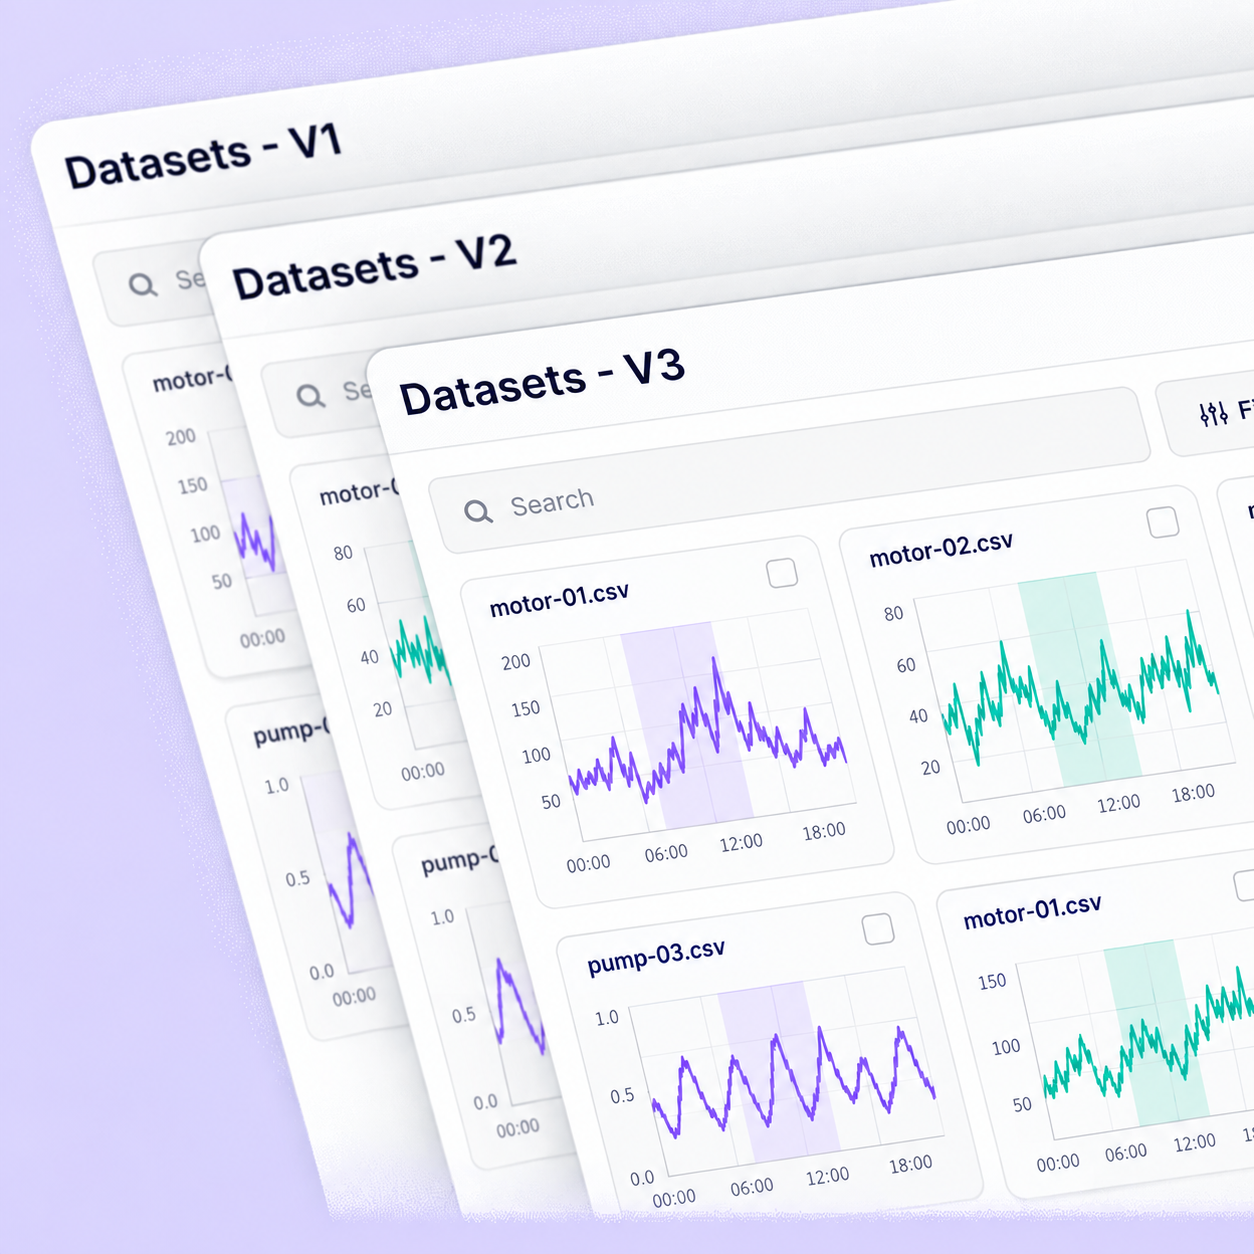
Create and manage dataset versions as sensor data evolves. Keep selected recordings organized and preserve reproducible snapshots for annotation and reuse.

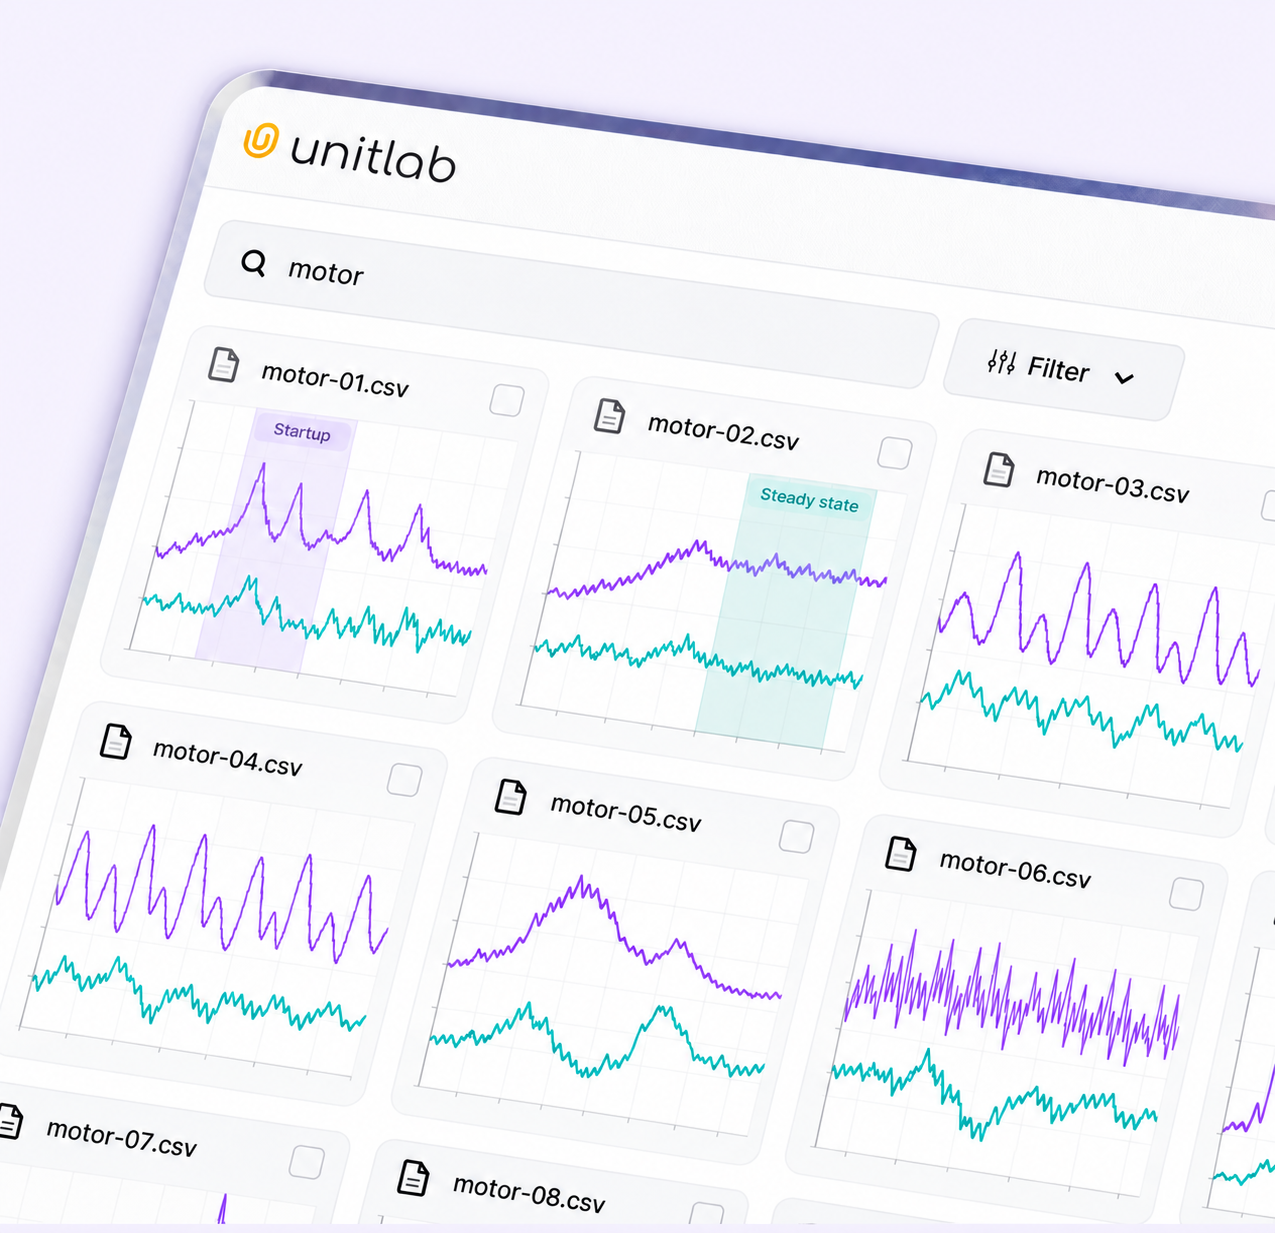
Find sensor recordings by name and narrow the data you need with filters. Inspect CSV chart previews before selecting work for annotation.

Inspect sensor examples, tag useful recordings, and select data that needs attention. Build a focused collection for labeling and review.

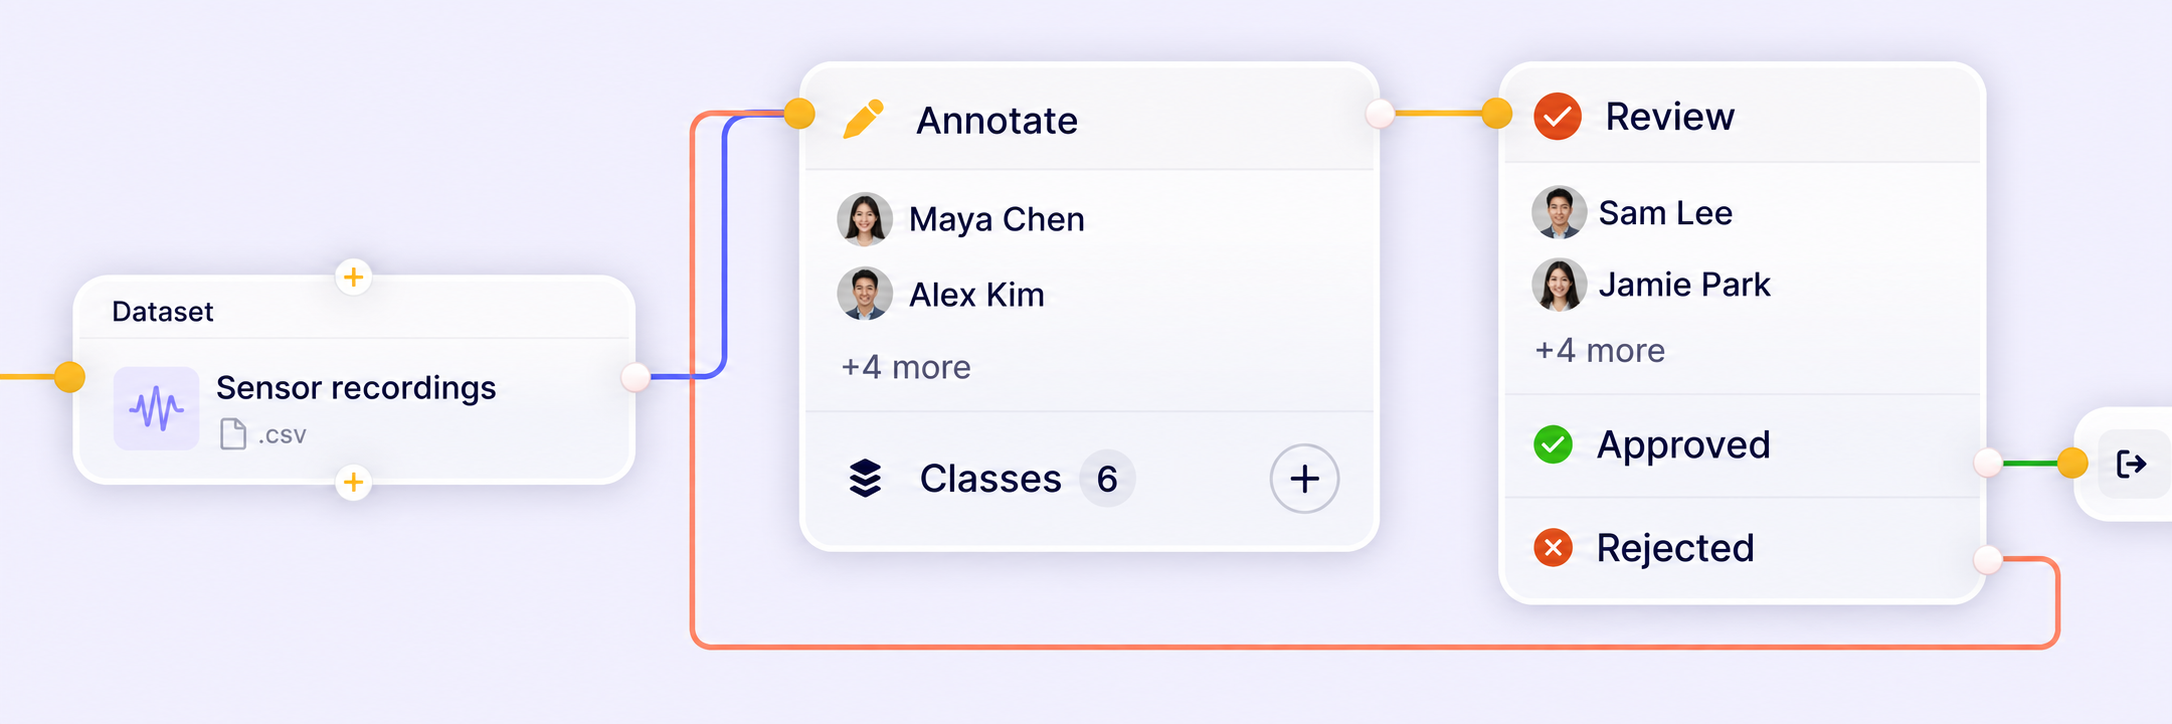
Connect sensor datasets, annotation, review, and approval in one workflow. Send rejected work back for correction while keeping the sequence of attempts traceable.

Export labeled intervals and point events with their original X-axis values, channel context, and properties. Prepare reviewed sensor annotations for downstream training.
Build labeled sensor datasets for industrial monitoring, connected devices, vehicle telemetry, and human activity research.

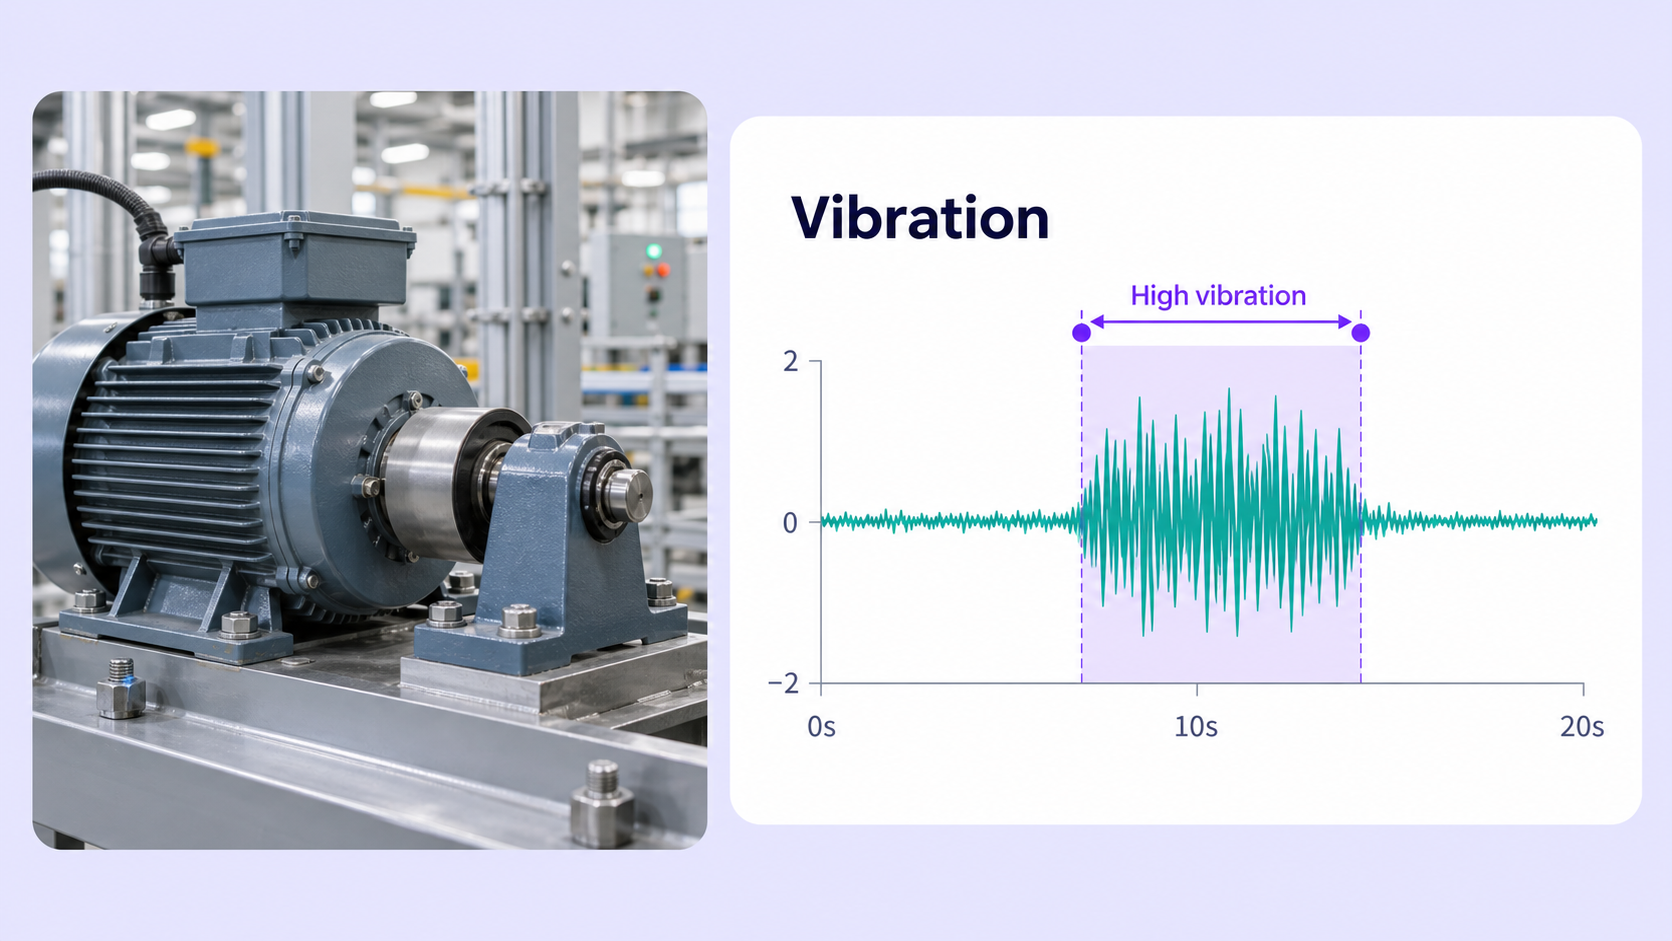
Label vibration patterns, temperature changes, and operating states to prepare training data for equipment monitoring and maintenance models.
Explore sensor workflows
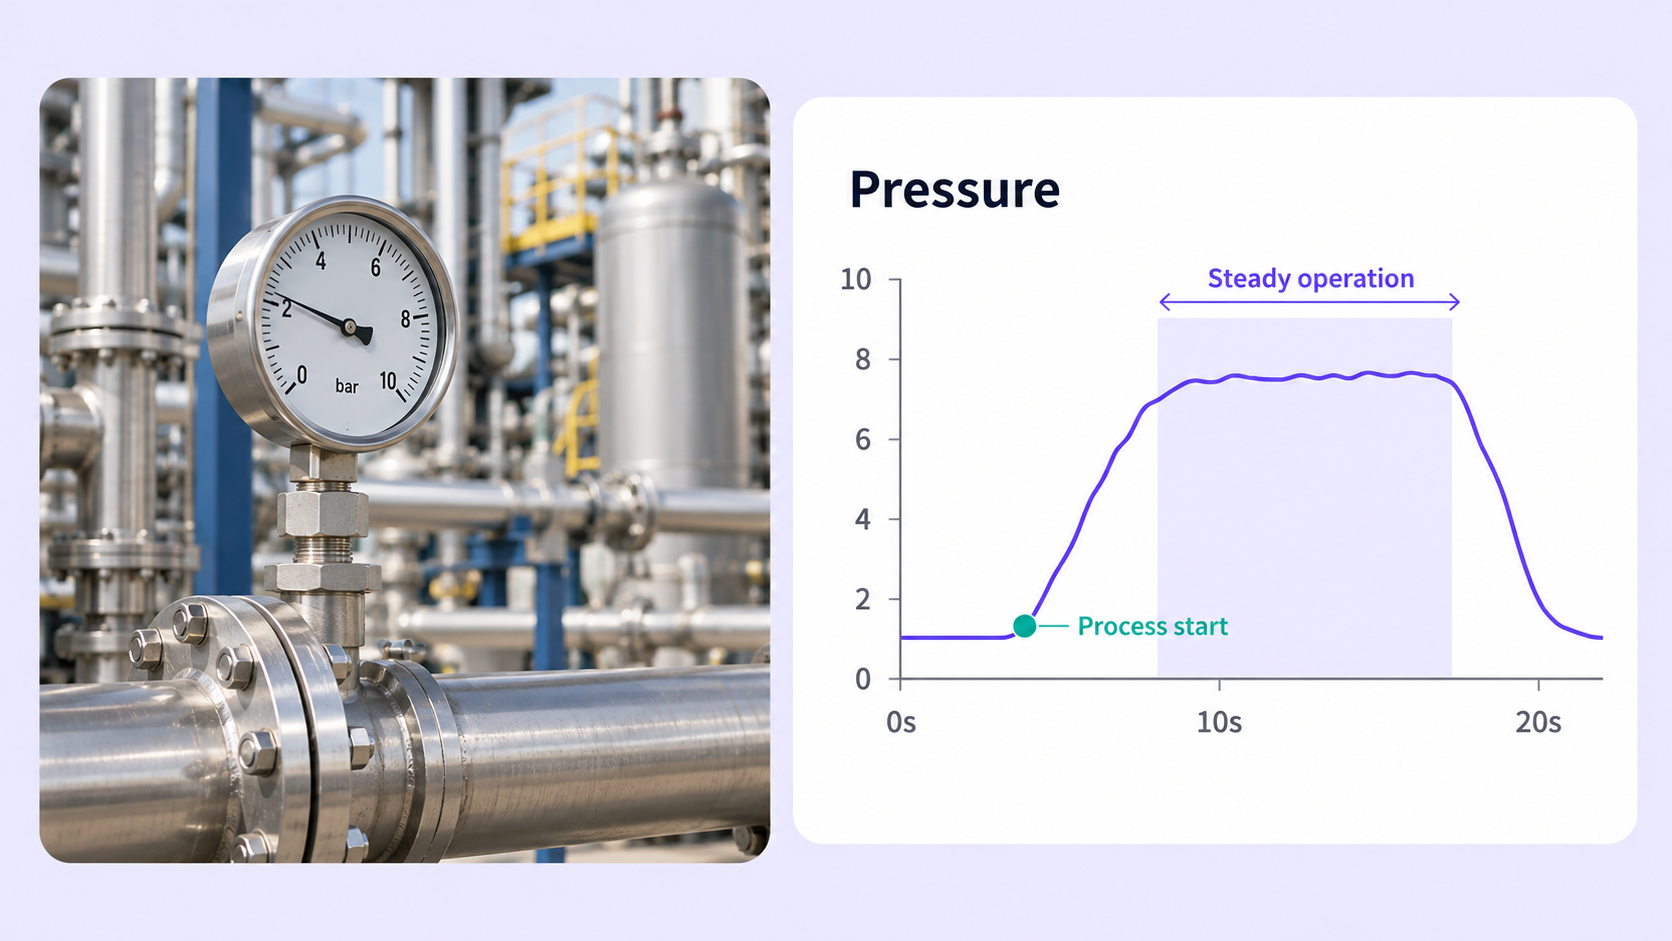
Capture process phases and meaningful events across pressure, temperature, and other machine measurements.
Explore industrial workflows
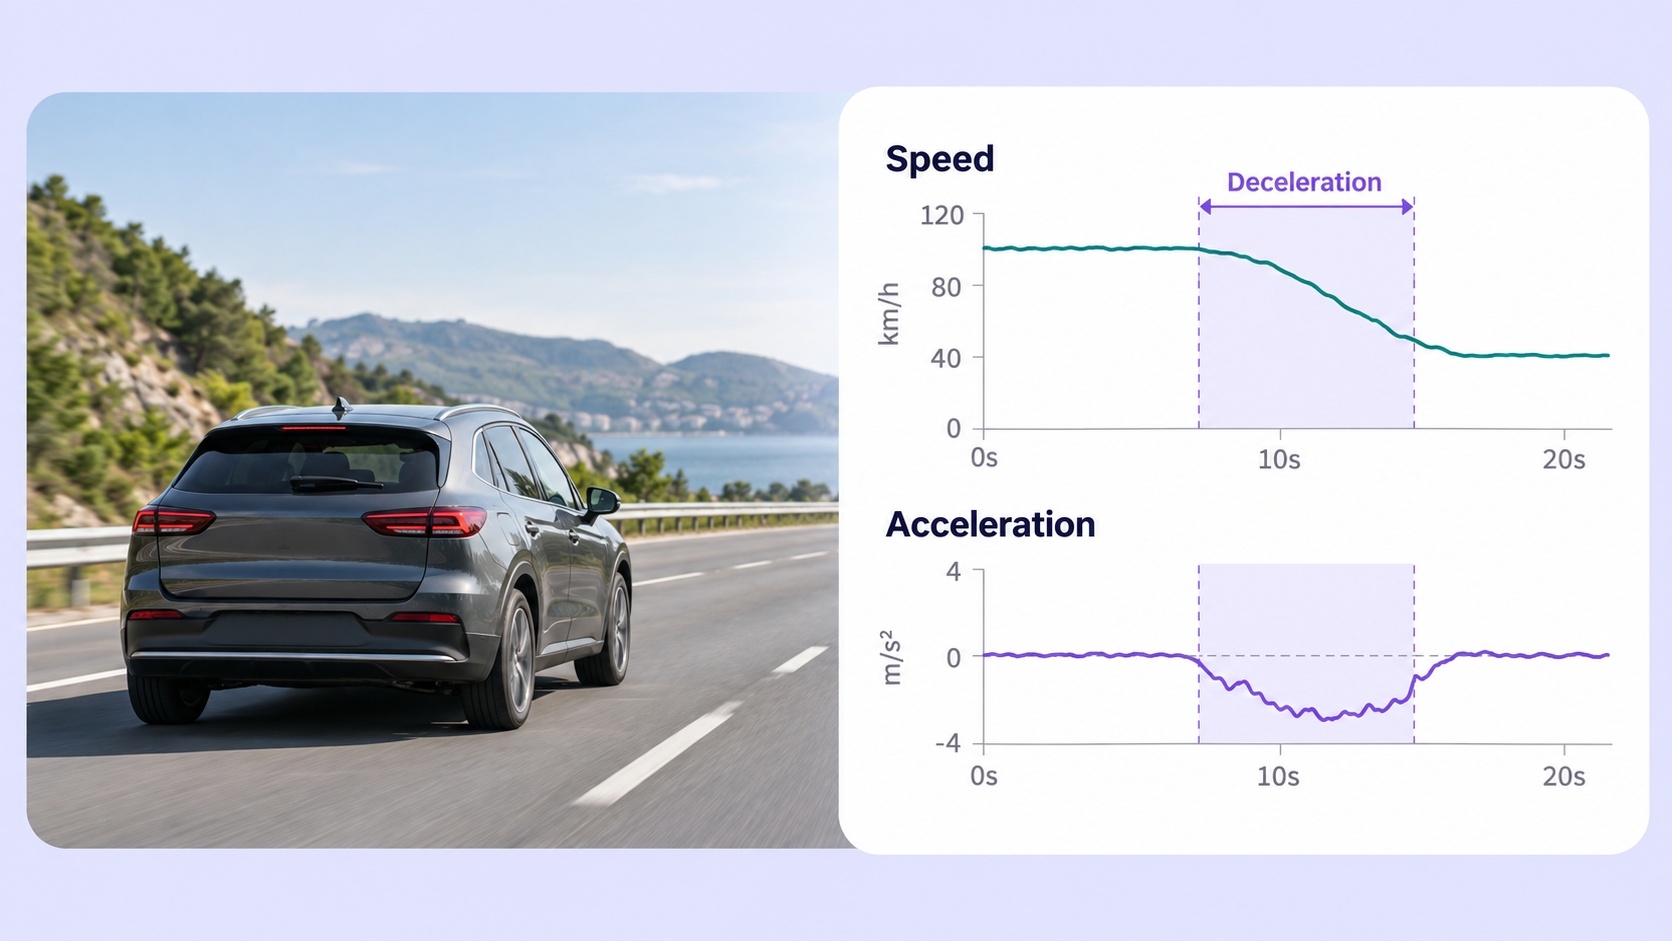
Annotate driving events and operating conditions in recorded speed, acceleration, and other vehicle measurement channels.
Explore telemetry workflows
Mark activity periods and transitions in wearable sensor recordings to support movement and behavior research.
Explore activity workflowsAnswers about sensor data annotation, CSV time series, range and point labels, multichannel inspection, ontologies, quality workflows, and dataset export.
Talk with the Unitlab teamSensor data annotation adds meaningful labels to measurements recorded over time. In Unitlab, teams mark ranges and individual events on CSV time-series charts, then add the structured context needed for their machine-learning task.
Explore Unitlab documentationUnitlab's time-series editor supports CSV files with a numeric or timezone-aware timestamp X-axis and numeric measurement channels. Teams choose the time-series interpretation and select the channels to display.
Explore data managementYes. Inspect channels in separate charts with a shared X-axis window or combine selected channels in one view. Labels can describe a particular channel or the recording as a whole.
Explore annotation toolsYes. Use ranges for periods such as an operating state or sustained anomaly, and point labels for individual events such as spikes or transitions. Your ontology defines the classes and structured properties used by the team.
Explore ontologiesSensor items can move through annotation, review, and rework stages, with comments anchored to the chart. Approved gold references and consensus workflows support quality checks where configured.
Explore annotation qualityYes. JSONL exports include labeled ranges and points, their original X-axis values, channel context, and supported properties. Datetime axes use UTC epoch milliseconds, while numeric axes retain their source unit.
Explore dataset exportsTime-series mode treats a CSV as one chart with an X-axis and numeric channels. Tabular mode treats each row as a separate record. Project configuration lets you choose the interpretation that fits your annotation task.
Explore tabular annotationCurate recordings, label ranges and events, review results, and export structured datasets. Keep your sensor annotation process connected from the first measurement to the final quality decision.